A Gephi of Ice and Fire: Visualizing George R.R. Martin’s Game of Thrones series
November 3, 2018 - All
Introduction
Arya (sorry, had to) ready for a detailed look at the Game of Thrones universe? Martin’s 8-book (and growing) series has captured the hearts of millions of people worldwide. His fictional world contains more than 790 characters, with plotlines that grow increasingly more complex as the series progresses. As a longtime fan of the book series, and as someone who is experiencing withdrawal while waiting for the show to come back next season, I wanted to dive into the books’ world through a network visualization exercise, using Gephi.
The core questions I came into this exercise with were:
- Who are the main characters in the series overall? In each book in the series?
- How do these main characters’ influences and connections to other characters change over the course of the series?
- At what point in the series can we begin to see the main characters interact with each other?
To remain compelling, book series must effectively balance a forward-moving plot and character development. How does one of the most popular authors of our time accomplish this feat so well?
Inspiration
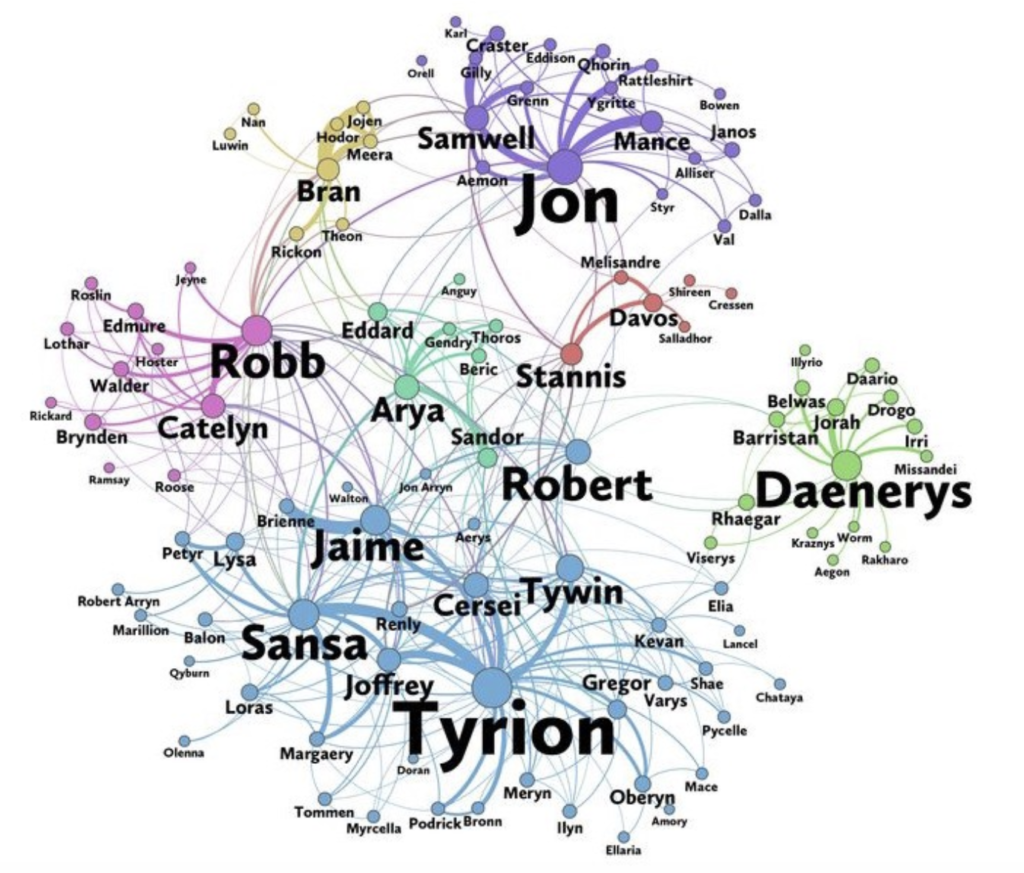
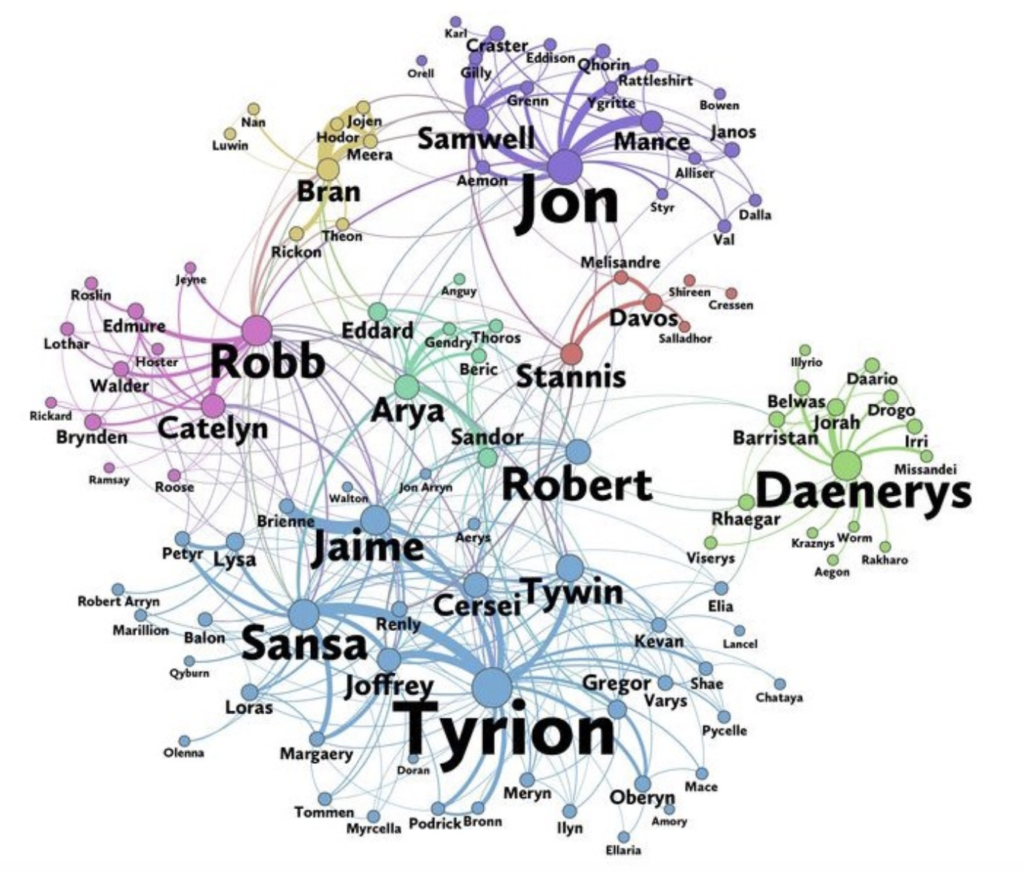
The power of Beniwal’s visualization comes through in his artful editorial paring-down of the 790+ characters into ones with the most connections. To do this, he used a pandas Dataframe to code the resultant nodes he wanted using # of connections (edges) as a parameter. I also like his use of color to provide an easy visual cue of each major hub for a community of characters.
2. Erin Gallagher’s #MeToo movement visualization
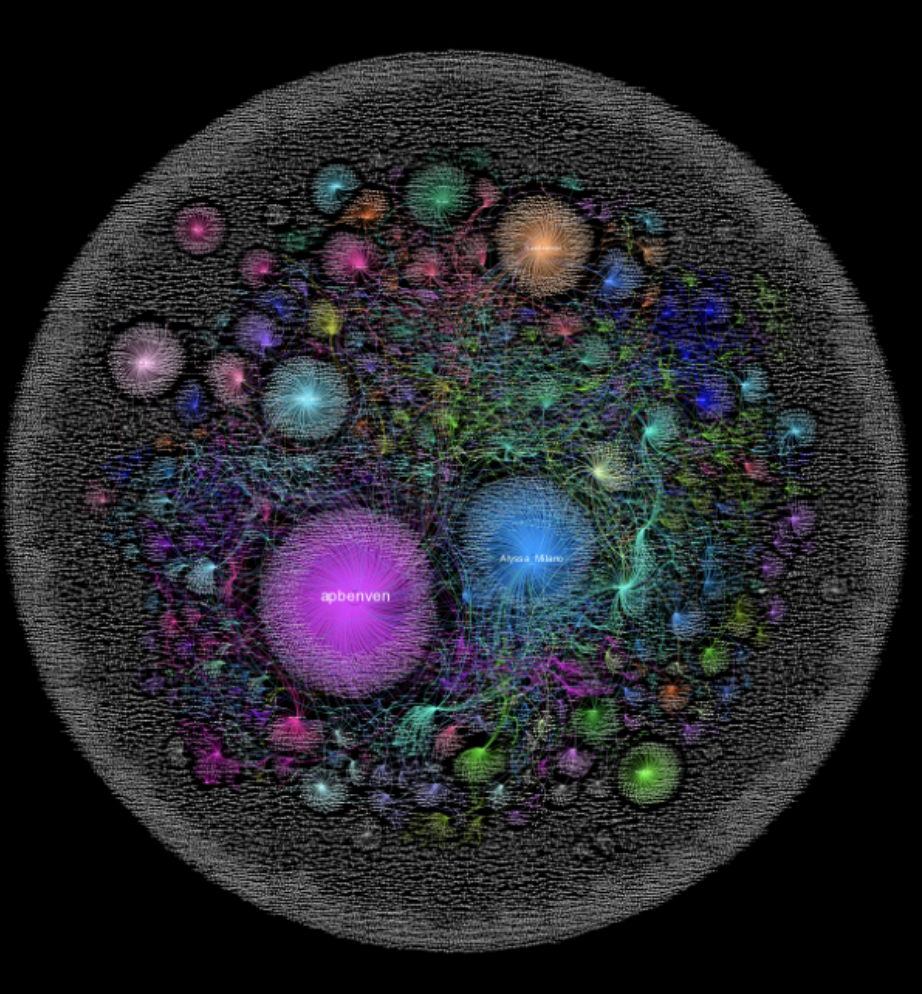
After collecting more than 24K tweets in 31 hours in October of 2017, Gallagher created a network visualization of the tweeters (nodes) and their connections. A stunning visual results, showing over 10,709 communities. She does a great job of illuminating the different communities through use of selective color (for the largest ones only), and proportional labelling. It is fascinating to see the visual representation of a social movement “going viral” here.
Materials
- Dataset: 8 CSV files: 4 node tables, and 4 edge tables; 3 pairs of tables represented the first three books in the series, and the last pair of tables represented all books in the series when data was combined across all 8 books.
- Sourced from Andrew J. Beveridge and Jie Shan’s Github
- Note: per Beveridge and Shan, in this dataset, “these networks were created by connecting two characters whenever their names (or nicknames) appeared within 15 words of one another in one of the books in “A Song of Ice and Fire.” The edge weight corresponds to the number of interactions.”
- Gephi for Mac: a free and open-source software. https://gephi.org/
Methods
I began by downloading the CSV files for the first three books as well as the overall composite files for all books from GitHub. I then imported the files into Gephi, starting with the Book 1 data so as not to be overwhelmed by a huge number of nodes and edges in my first foray into Gephi. Before playing with layouts I ran statistics on the network to be able to better understand its shape. These included degree, diameter, density, and modularity. I also took note of the number of nodes and edges in the file. In my first run-through, I kept modularity resolution at 1.0 to see what the initial output would look like. I then ran a layout called Force Atlas 2. The first attempt was a jumbled mess of a hairball, that was fairly meaningless, so I began to dig into the layout settings in order to come up with something more helpful. Because everything was so tightly packed, I applied settings like Approximate Repulsion, Dissuade Hubs, and Prevent Overlap. These helped, but only just a bit. I then played around with weakening gravity to achieve the effect I wanted, and still had some issues. After consulting with my professor (thanks Dr. Sula!), I tried another layout, called Expansion, which can be run as many times as the user needs to achieve the intended spacing. Now that I could see the major nodes, I added a partition by degree to the nodes to replicate their proportional degrees visually, and also added a partition to the nodes by color to show modularity (in an effort to show communities by color). For the edges, I had to rescale the weight in order to eliminate a lot of visual noise that was presenting due to some highly connected and weighted characters (the main characters). I also removed the proportional size setting on labels so that nodes could be more easily identified, considering how many nodes were present. Last but not least, I spent some time playing with the resolution / modularity in order to find a sweet spot that I was happy with that best illuminates the major character communities; I found this to be 1.3 resolution.
With these settings and adjustments in mind, I then imported the data and performed the same stylistic manipulations for Books 2, 3, and all books combined. I kept the resolution the same, at 1.3, to keep a sense of control and consistency throughout each viz.
Lastly, I wanted to try out some of the other layouts available, and downloaded a package with a layout called “Circular Layout.” I really liked how clearly this layout showed the central characters and communities in each book, by ordering it by modularity, and so I created circular layout graphs for books 1-3 as well as all books combined.
Results / Discussion
All Books
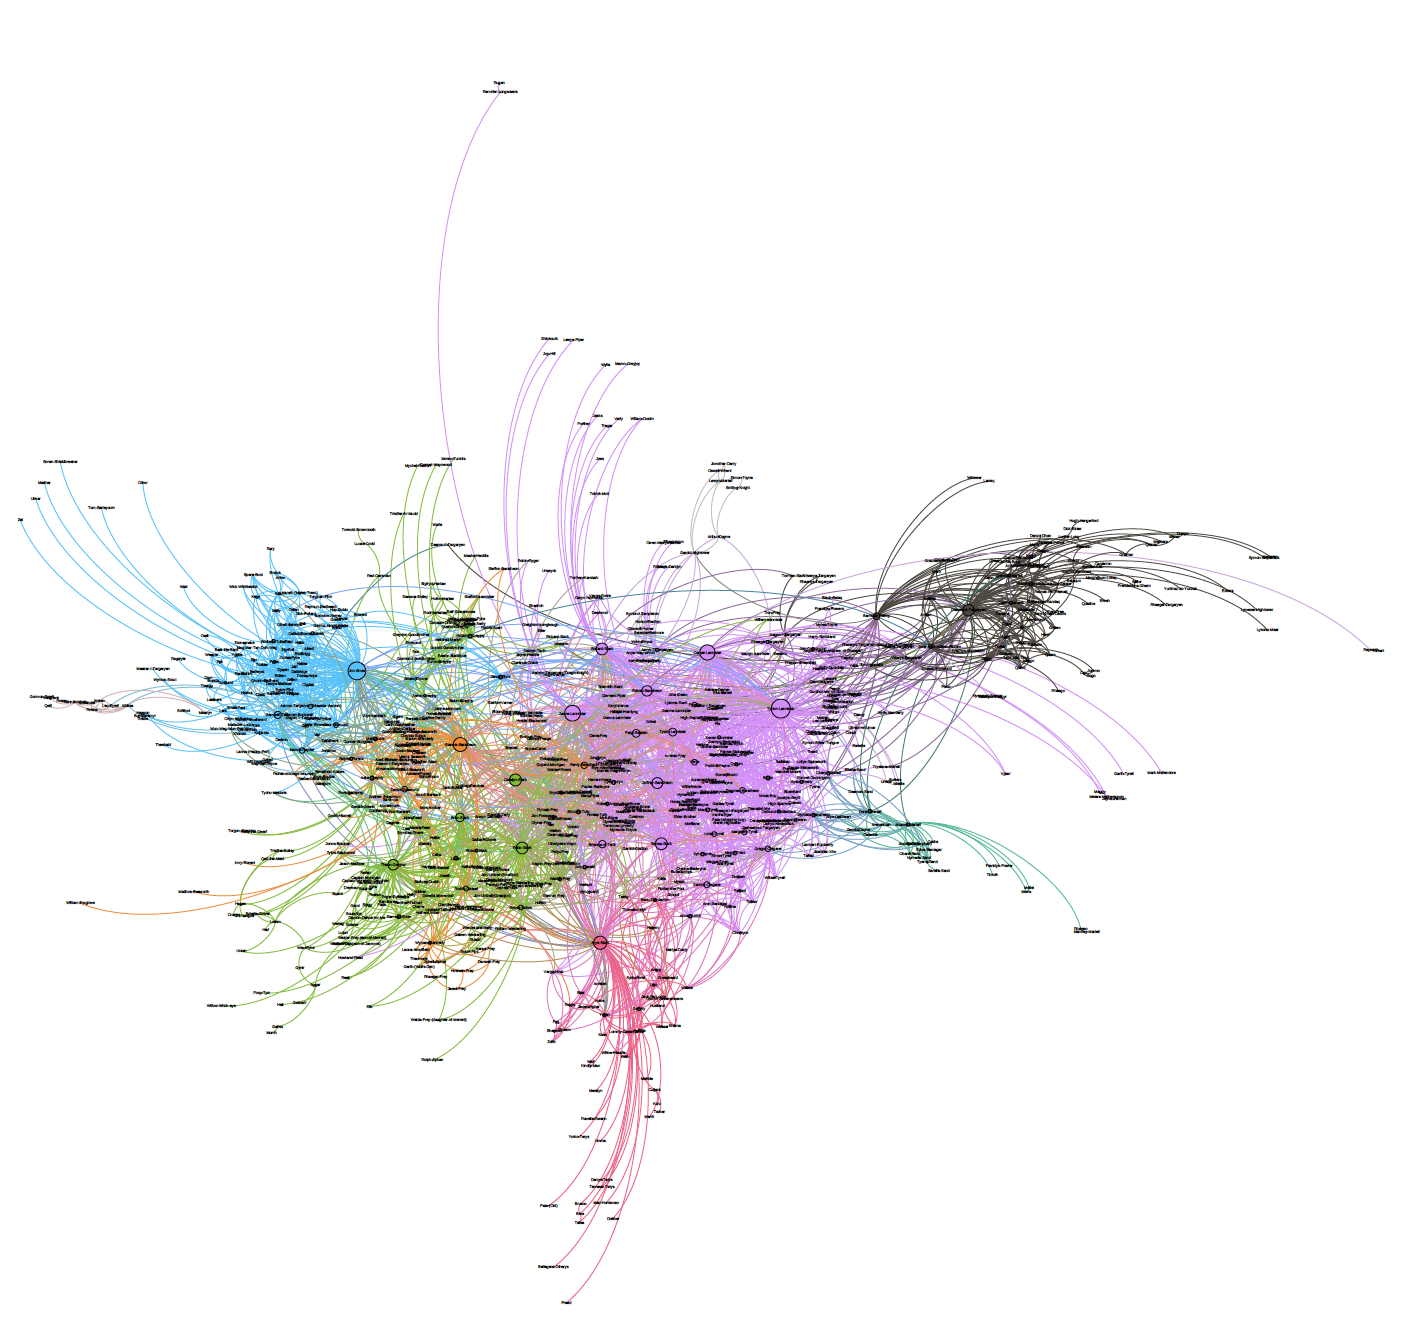
As you can see from the visualization of all books combined, the expansion layout shows the immense depth in this book universe, with over 796 nodes and 2823 edges. Without providing an interactive layout, it is difficult to see much, if any, meaningful detail, other than the fact that 7 major communities of characters seem to arise. 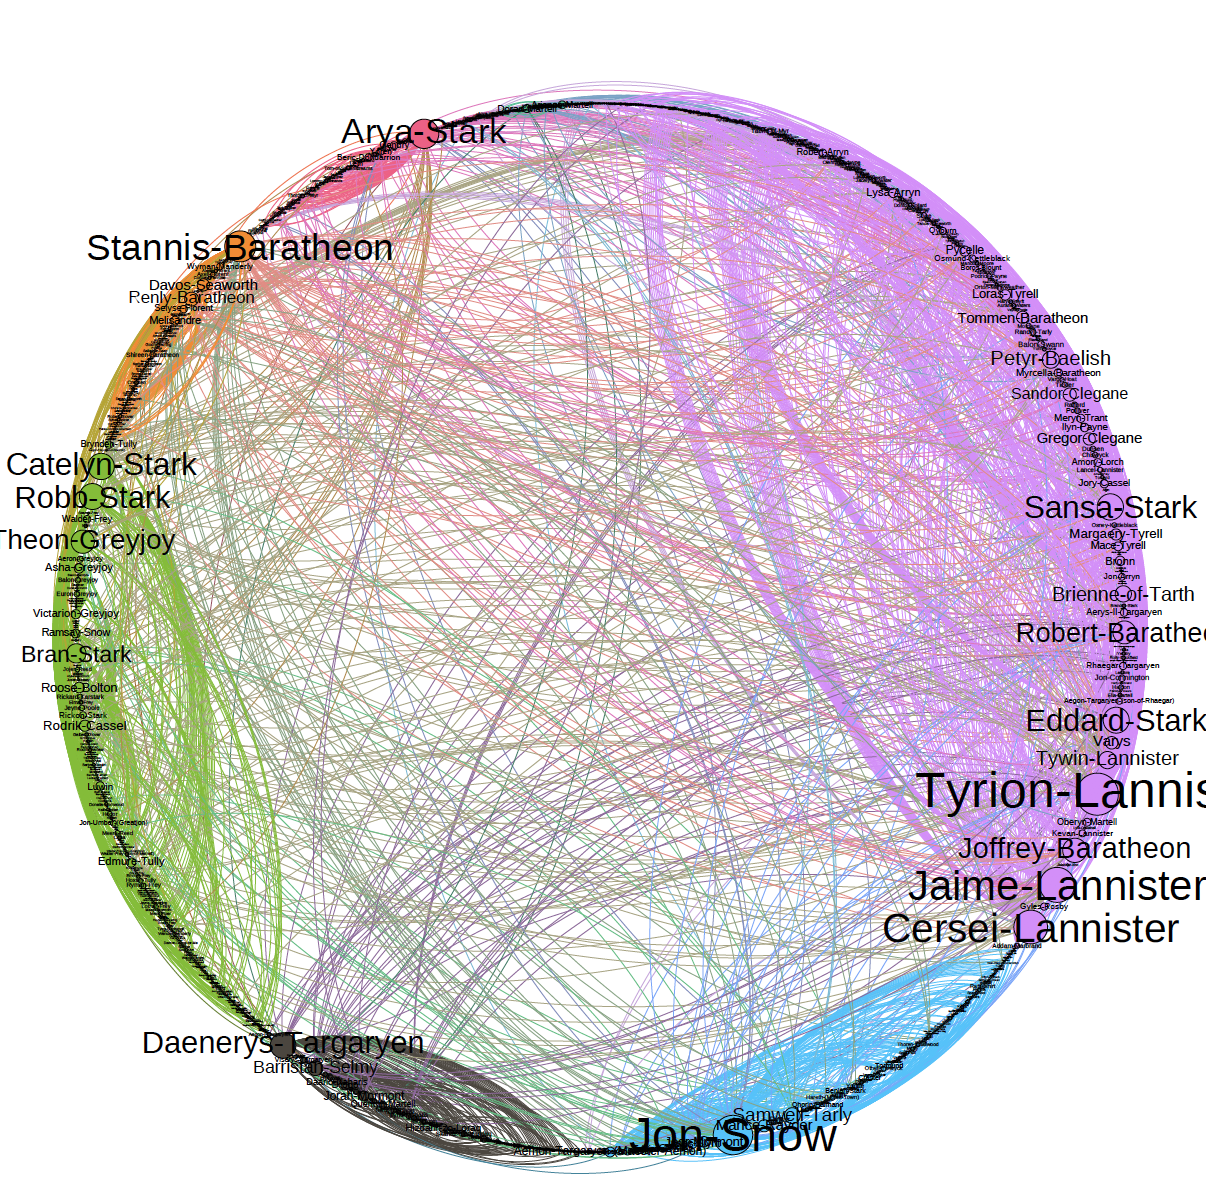 When we look at the circular layout, however, we begin to understand exactly who these main characters are and how they interact with other communities:
- The Lannister family, who interact with each other and some of the Starks (Sansa and Eddard) most often, although they have crossover into the Targaryen and Stannis Baratheon plots as well.
- Jon Snow, who interacts within a smaller sphere of influence overall (likely characters from “the wall” and “beyond the wall”). He also has proximity and ties to Daenerys Targaryen, which becomes central to the plot later in the books.
- Daenerys Targaryen, who drives her own storyline without much influence from the other main characters as she strives to unite the Dothraki and liberate Meereen. Only when she gathers ships and is able to ride her dragons, can she begin to network with the other main characters.
- Another set of Starks – less tied to the Lannisters and more standing within their own plots: Catelyn, Robb, Bran.
- Stannis Baratheon, who stays mainly with a very small sphere of influence within which he is a central character.
- Arya Stark, who has cross-over to the Lannisters, the Starks, but mainly has her own plot going on, similar to Stannis.
In this top-down analysis, we begin to see who drives the main storylines of GOT, as well as which characters’ reach to other characters may be limited through their physical location. For instance, although Daenerys Targaryen and Arya Stark are central characters in the series, they have small arcs in the circular network, mirroring the isolated locations in which their stories take place.
Books 1-3
If we look at snapshots of Books 1, 2, and 3 from an expansion network perspective, we see that Book 1 starts with four main communities with correlate to the four major plotlines: the Stark/Baratheon conflict, the Targaryen siblings storyline, the introduction of the Lannisters, and the story that follows the Snow and Stark siblings after Eddard’s death. Because this was more simple in nature, I could afford to use proportional labelling.
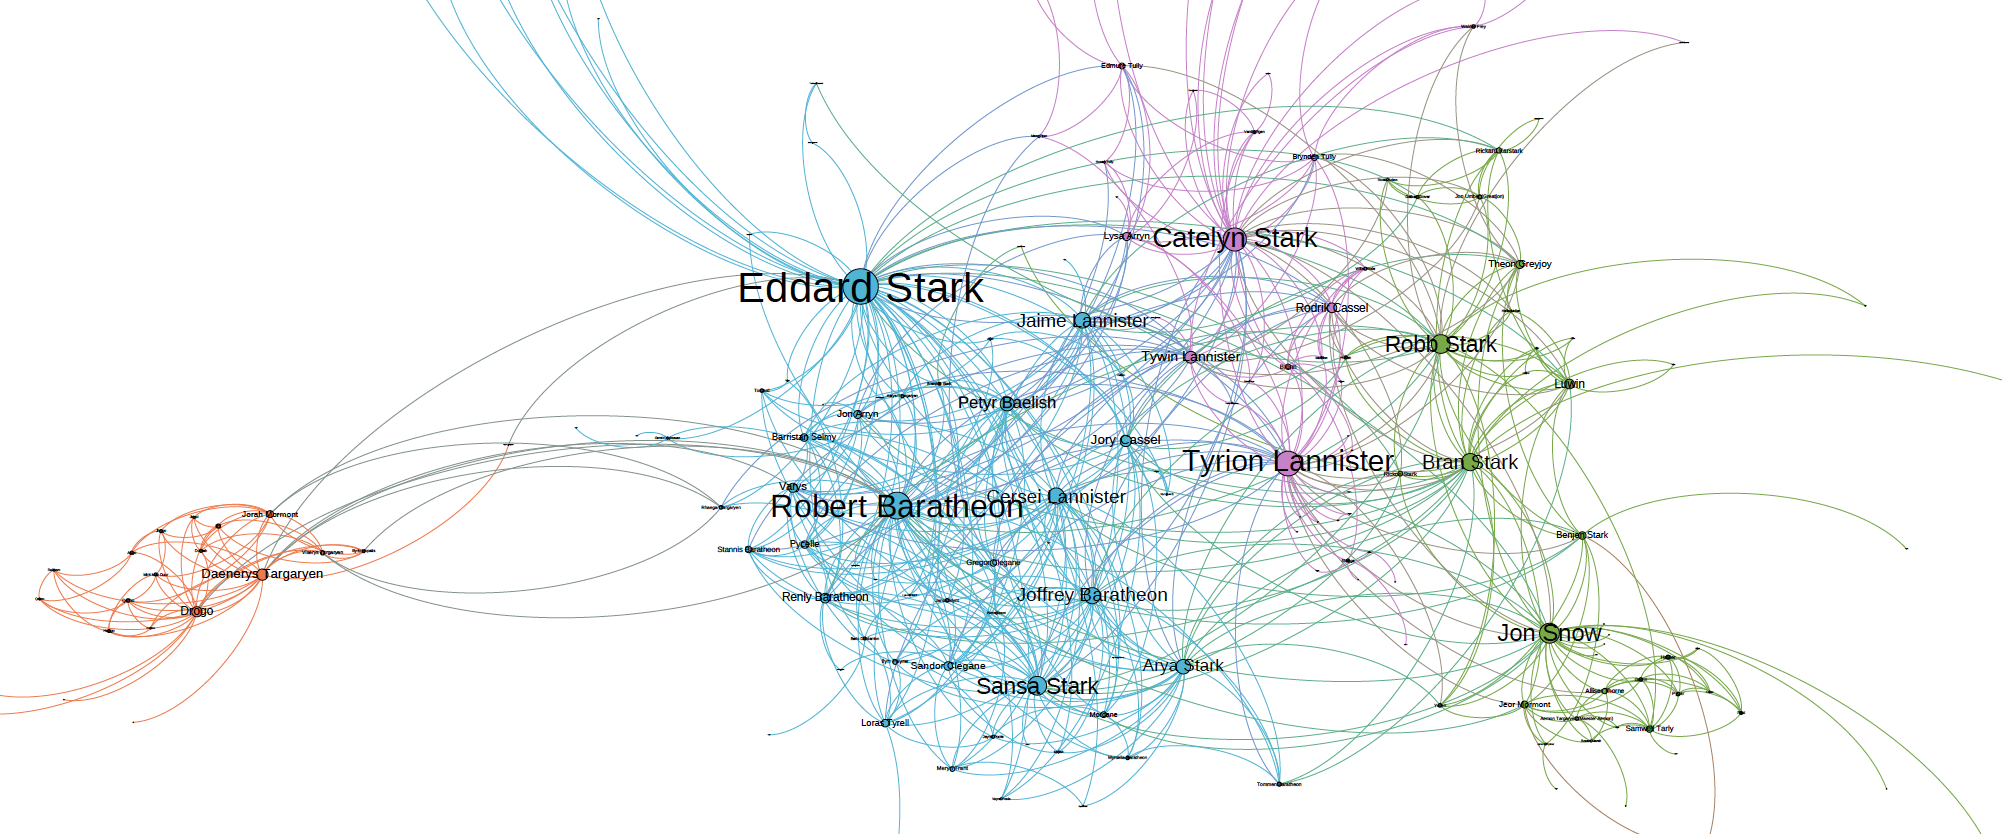
Book 1
However, very quickly, more and more characters enter the picture in book 2, and the network gets too complex to use proportional labelling – here the node size reflects character connectivity. In Book 2, Jon Snow gets his own community via his trip to the wall, the Stark siblings continue to splinter off into separate journeys (although these are not yet reflected in separate communities quite yet due to resolution of modularity), Arya notably goes off on her own journey, and the new Stannis storyline begins.
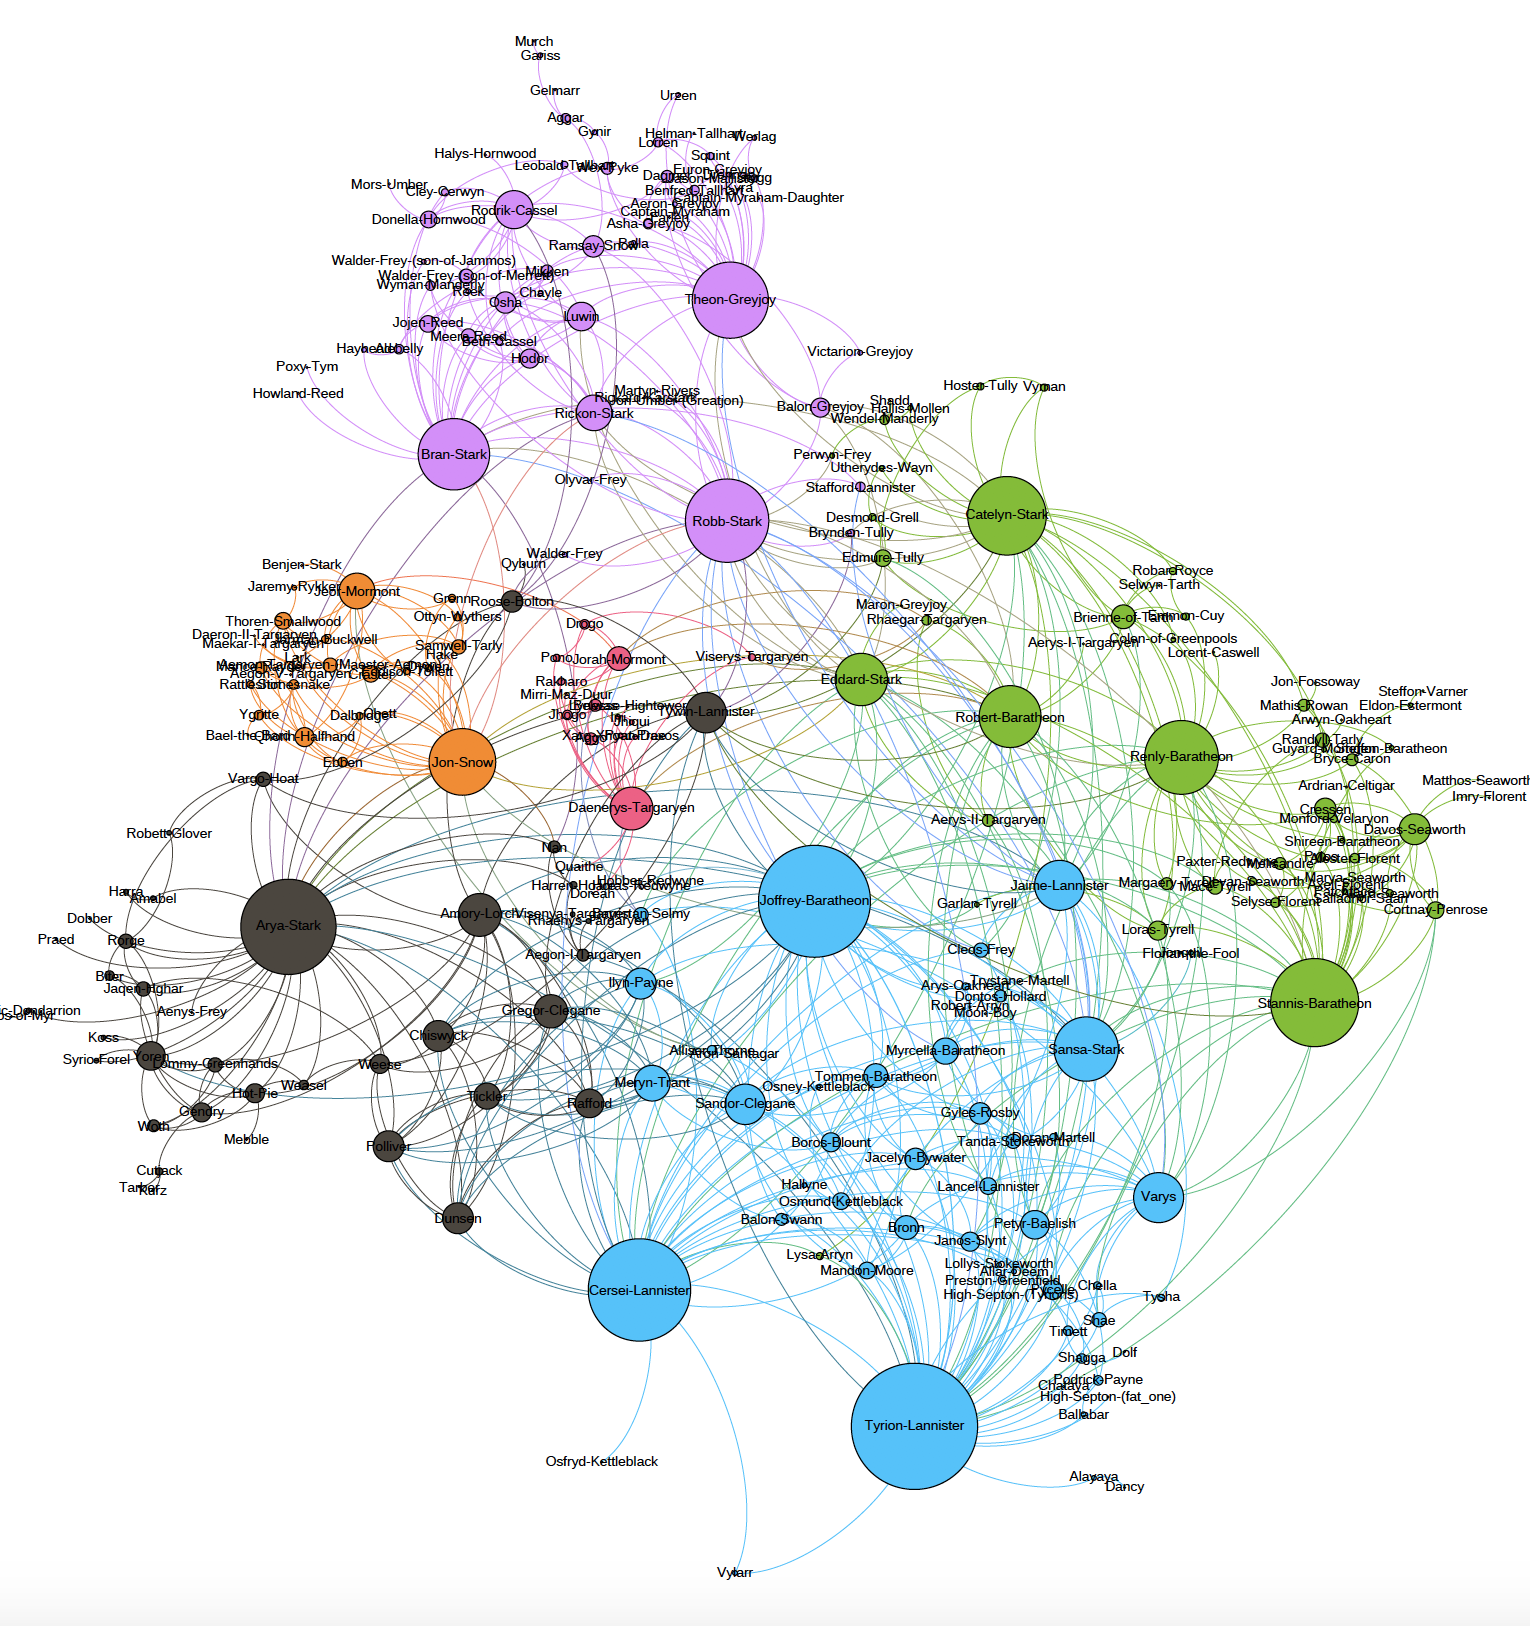
Book 2
And then finally, in Book 3, we see the network has gotten even more complex and full. The Lannisters are gaining power and storylines, and their conflict with Catelyn and Robb Stark show through their proximity. Baratheon is much closer to the Lannisters as he seeks the crown, and the three distinct stories of Jon Snow, Targaryen, and Arya Stark continue to unfold on their own. If we were to follow this story through all 8 books, I can imagine we’d see these interactions further mirror character location and story focus.
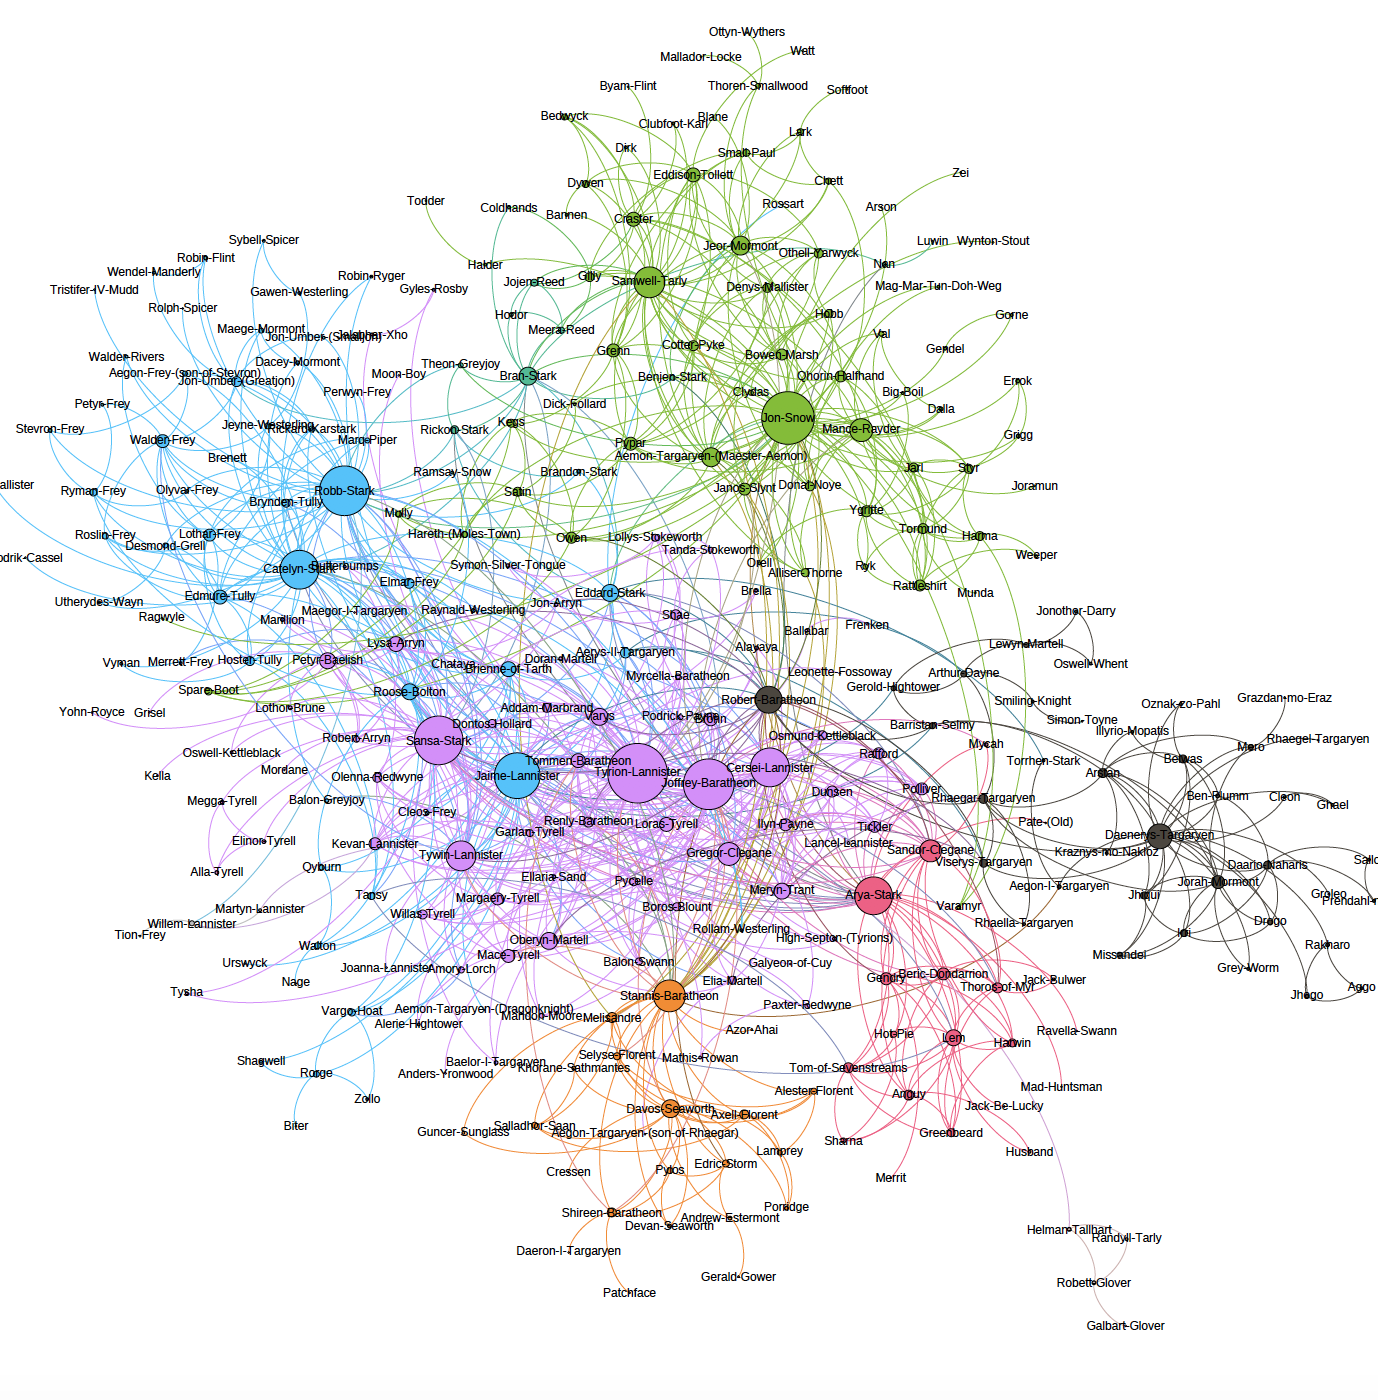
Book 3
For the sake of time and space, I won’t continue to analyze the circular layouts that I created for each of these books, but they do provide an even more in-depth look at interactions between communities.
Future thoughts
As may have quickly become apparent in this post, I think it is essential that Gephi implements a way to provide interactivity. Without the ability to manipulate the graph, viewers are limited to the scale and editorial choices that I make as this post writer. To really understand the intricacies of such a vast universe of characters, I think interaction is essential.
Should I wish to pursue this topic further, I might also consider investigating how to weed out lesser characters’ labels, keeping the nodes intact, but allowing the main narratives to surface more cleanly in the visuals.
And, last but not least, I’d be interested in seeing whether Gephi could import a map of Westeros, so that we might align the characters and their interactions over the map to see the geolocation of most interactions in each community.
The post A Gephi of Ice and Fire: Visualizing George R.R. Martin’s Game of Thrones series appeared first on Information Visualization.