The Evolution of the Coca-Cola Bottles
July 2, 2018 - All
Introduction
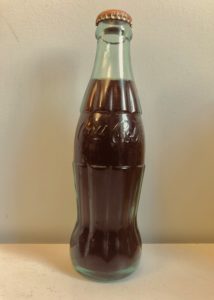
Serval days ago, I bought an unopened, vintage Coca-Cola, the owner of that vintage store, could not tell me when was that Coca-Cola being produced. I always thinking about to figure that out myself, and when I saw the TimeLine JS project, I thought about this right away.

During the research of this project, I figured out that my bottle was supposed to be produced between 1957 to 1961.
Material and Tools
I found the resources and references from Coca-Cola’s website, and the tool I used this week is Timeline JS. From the Timeline JS tutorial, I learn that I can edit my timeline project by using a google sheet. When I copy and paste the URL to the Timeline JS preview Page, I will be able to see the results.
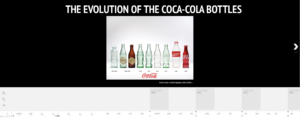
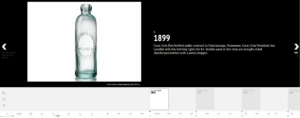
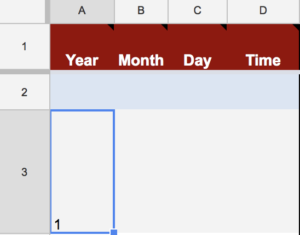
However, there is one thing that I found interesting, due to the default program setting, the first column of the google sheet was set to be mandatory filled up in numbers. Otherwise, the Timeline JS program will not be able to recognize the sheet to preview.
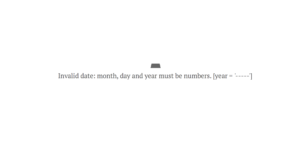
So I put numbers into this column, to make the sheet be able to preview. This makes me think: The default Timeline JS google sheet can be a great tool for presenting the projects that have time and headlines or names; What can we do if there was no certain name of each project? I found the answer from the Q&A section. If I want to specifically edit the design, I will need to insert the personalized Javascript Code to the Timeline JS CSS.
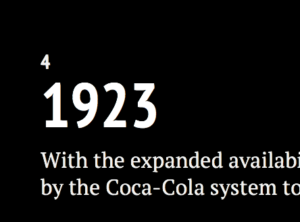
Final results
Future Directions
From this project, I explore a good tool for showing project process and history. As designers, we always face the problem of presenting our design process, which needs to be simple and clear to the clients. I think Timeline JS can definitely help. Further, the google sheet based program also allows the efficiency and the flexibility of the projects. Not only the design process, it can also be a good tool for showing the history of a brand before we start to design for a brand when we do the background research at the beginning.
Further, based on this project, I think that it will be necessary for designers to know the basic of HTML, CSS, and Javascript, basic coding skills seem to be necessary for information visualization designers. From Stephan Few, “Visualizations, as it applies to visual representations of information, can be preceded by three words, creating three terms with somewhat different meanings:
- Data Visualization
- Information Visualization
- Scientific Visualization
I use data visualization as an umbrella term to cover all types of visual representations that support the exploration, examination, and communication of data.” (Few, 12) Data, Information, and Scientific elements support the exploration, examination, and communication, which means it will work as a well-designed system which with enormous databased. This fact to me means, in order to make the system work, it won’t be feasible to play unless we have the machines to help us. With emphasizes the idea that for Visualization Designers, to have basic coding acknowledges is necessary, or even unavoidable. Reference
Few, Stephen. Now You See It: Simple Visualization Techniques for Quantitative Analysis. Analytics Press, 2009.
The post The Evolution of the Coca-Cola Bottles appeared first on Information Visualization.