Project Description
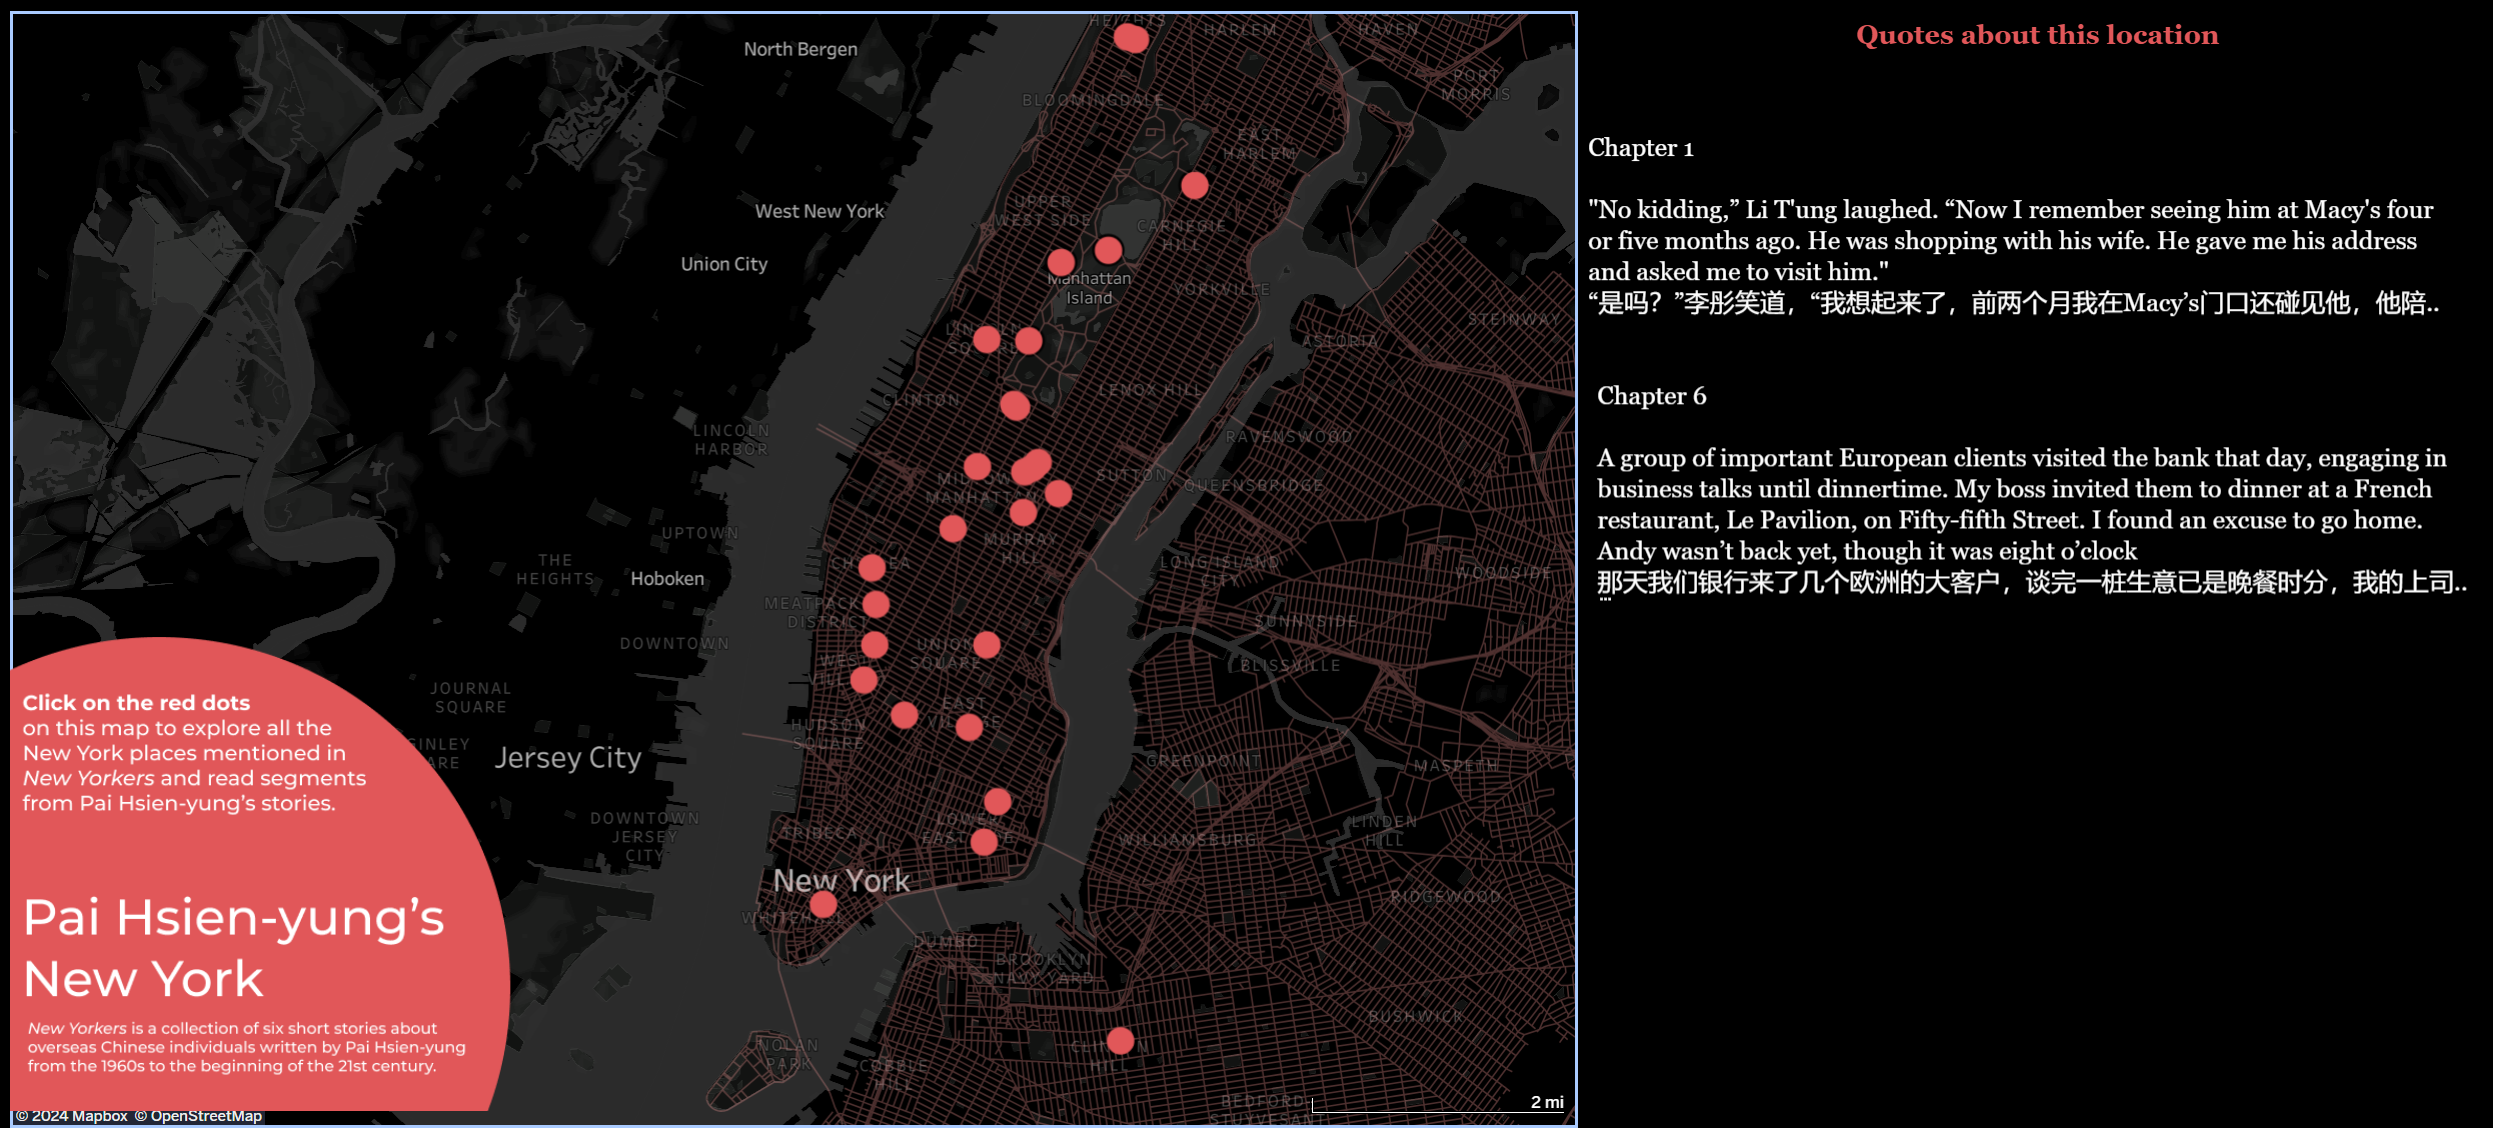
For this project, I created a reference site including an interactive map of all the New York City locations mentioned in Pai Hsien-Yung’s short story collection “New Yorkers”
Data Source: New Yorkers — a short story collection by Pai Hsien-Yung
Tools: Tableau, SQL, Javascript
Project Background
Pai Hsien-Yung’s work in “New Yorkers”, penned between 1965 and 2003, is a work that offers a poignant exploration of the lives of Chinese individuals navigating their new lives in the foreign city. Pai Hsien-Yung’s work serves as a cultural and historical artifact as the stories explore themes such as displacement, cultural tension, and identity amidst the ongoing tussle between Chinese traditions and Western influence.
Due to a number of political and cultural reasons, despite the valuable insight it provides, “New Yorkers” remains relatively underrecognized, particularly among the newer generations of Mainland Chinese navigating their own realities in the city—which, in my personal view, is such a shame, as members of the community might very well find that Pai’s work often mirrors their own experiences.

Hence, I want to use this project as a way to bridge that gap. This map is a part of a larger site that provides a geographical reference to all the NYC locations in the book and connects the quotes to social media posts about the same location.
The Process
Gathering the Data
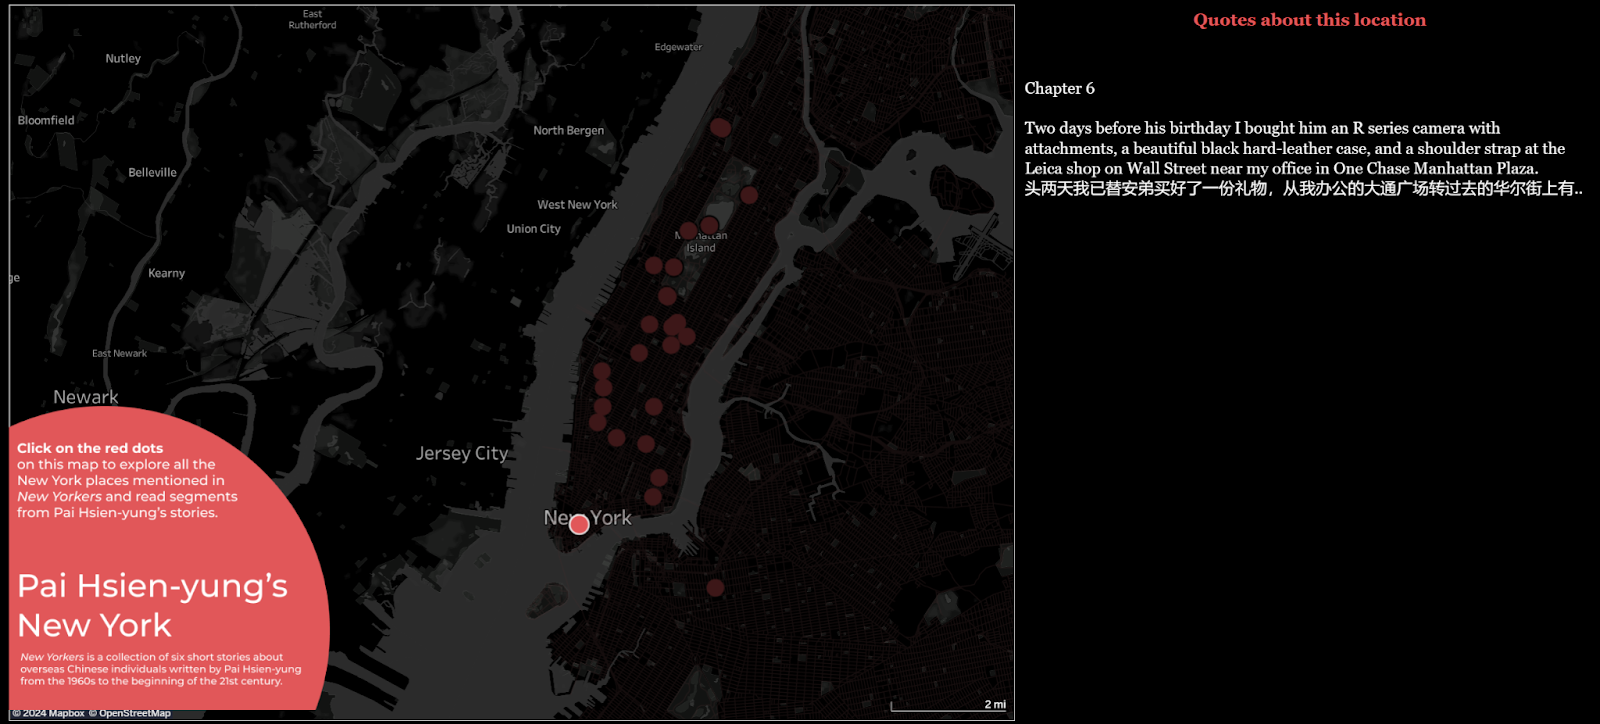
The data for this map was compiled manually. l went through each story in “New Yorkers.” I pinpointed each mentioned NYC location, extracted relevant text segments, and collected geospatial data via Google Maps. As the stories were published separately over nearly four decades before being put together for the short story collection and there is no English version of the book itself, the English translation of each story exists in different sources. With the help of my old comparative lit professor, I was able to find a list of all the translated works of Pai and spent a very long time searching for the actual text of these listed journals. I wasn’t able to get my hands on the translation of one of the six stories called ‘Nocturne’, as the translated version was only published in the summer 1980 edition of “the Chinese PEN”, a Taiwanese journal that I just couldn’t find a digital copy of. So I resorted to translating the quote myself.


Preparing the Data

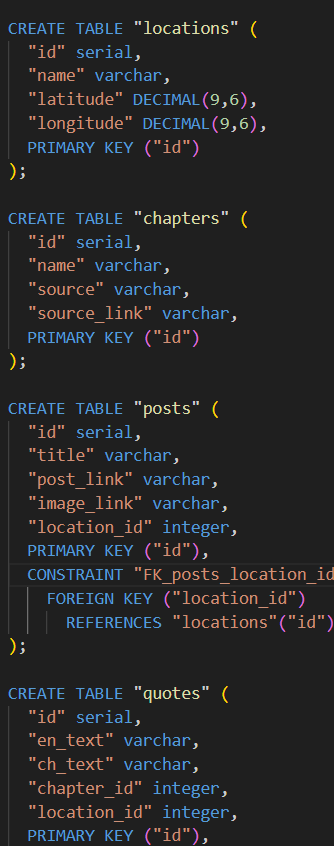
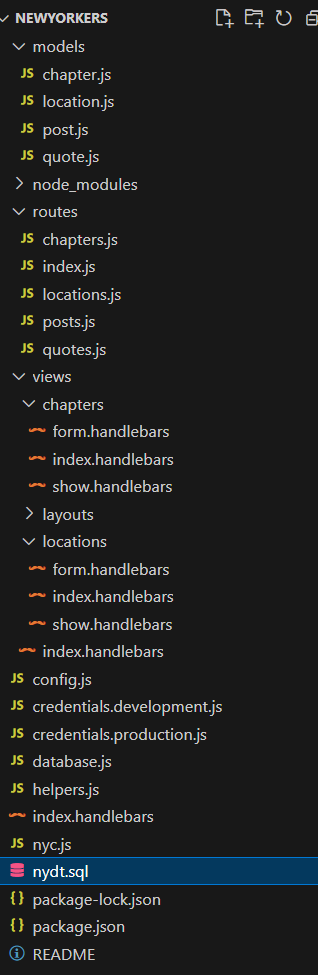
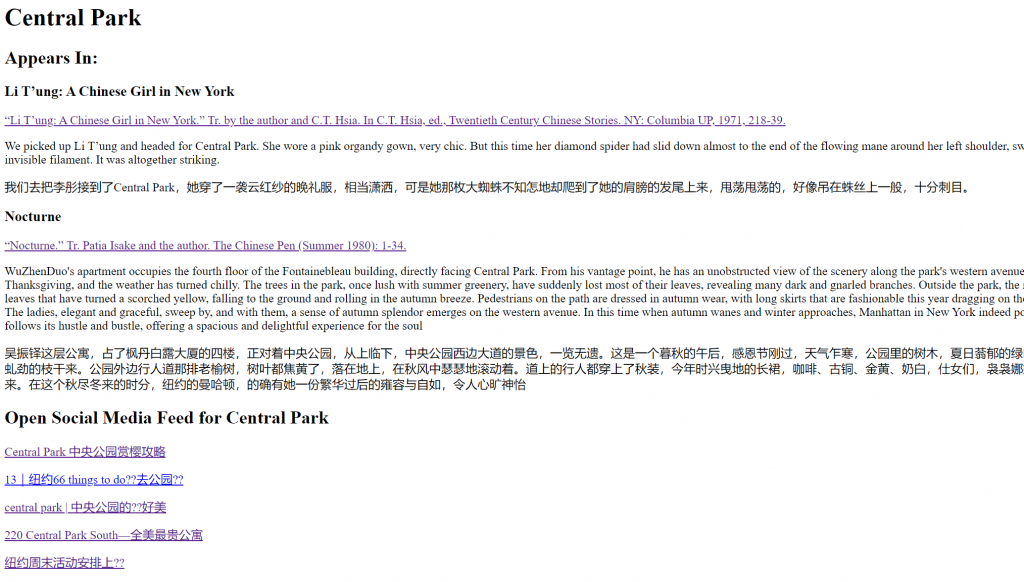
The structure of the data is more complex than can fit in a single sheet, as each location can be mentioned in multiple chapters, and each chapter can have multiple quotes. To manage this, I created multiple tables according to the relationships between entities—chapters, locations, quotes and posts—and created a data base using PostgresSQL. This setup allowed for a dynamic interaction where users can click on a location and see the associated quotes from the book, organized by chapters.
For the map, I was able to directly join the tables in tableau.
Making the map
From there, I was able to map each location onto a map of New York City and configure the tool tip to show each location name and the chapters the location appeared in when the user interact with each marker.
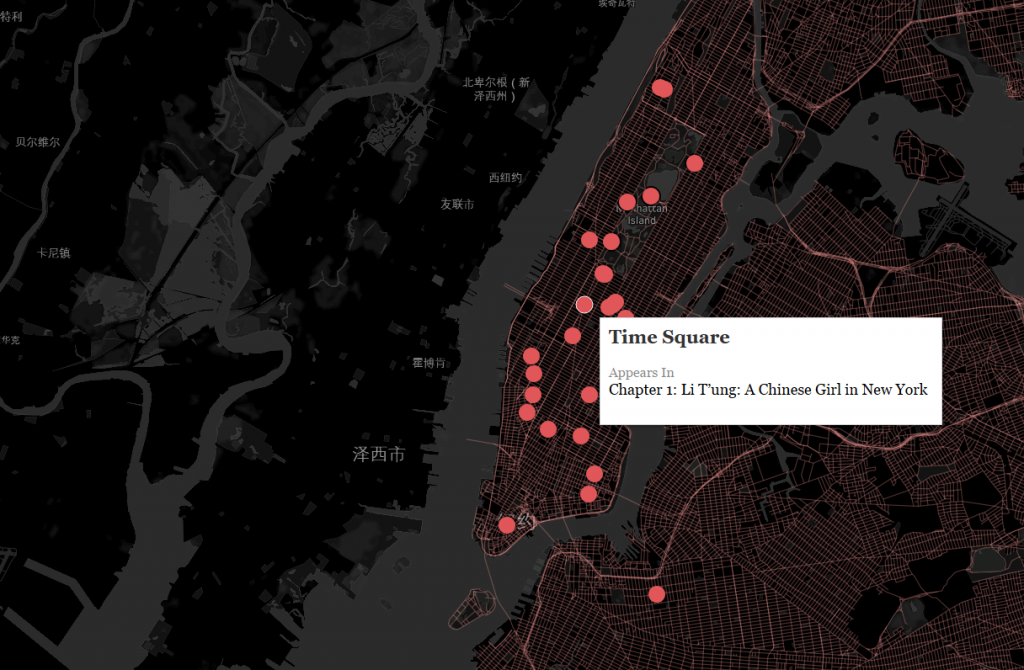
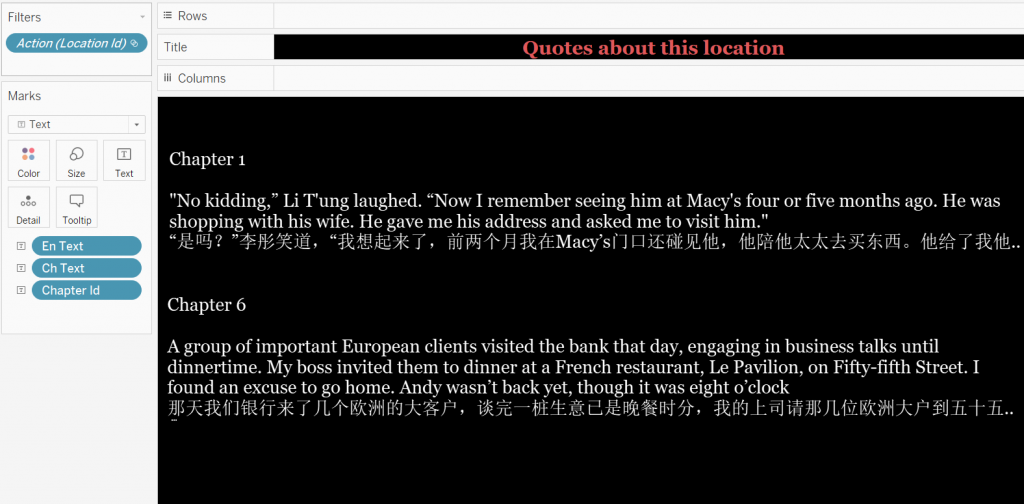
Then, I created a second sheet that displays the relevant English and Chinese text based on locations as a filter.
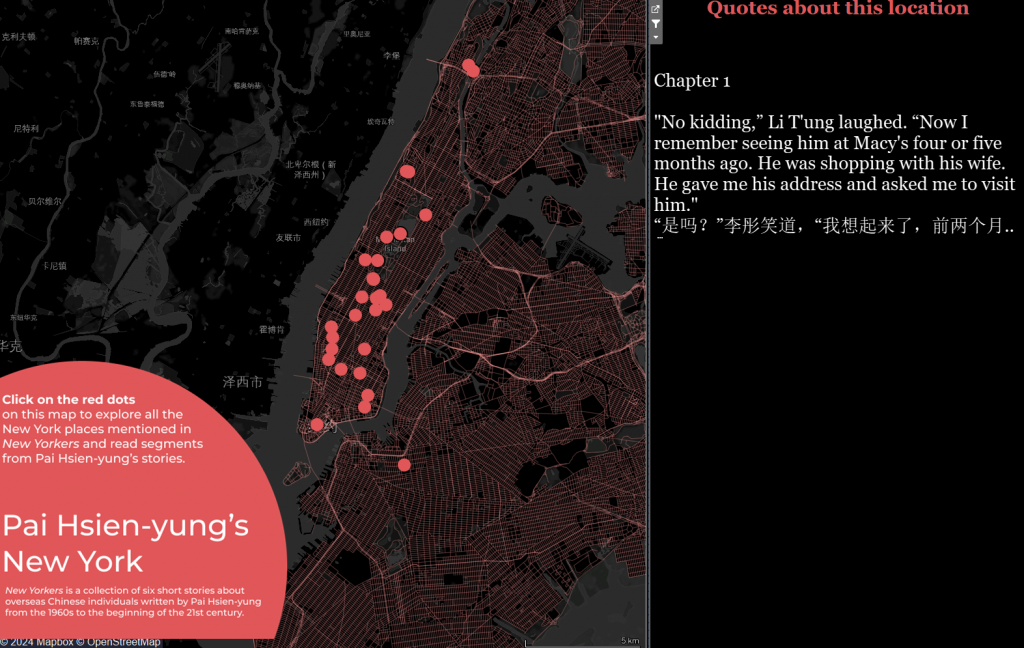
From there, I combined both sheets in a dashboard and used the map as the filter for the side display.
Making the site
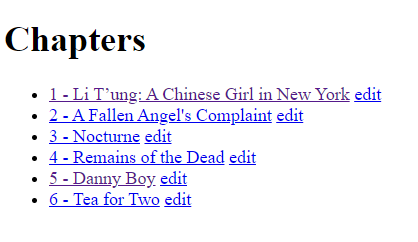
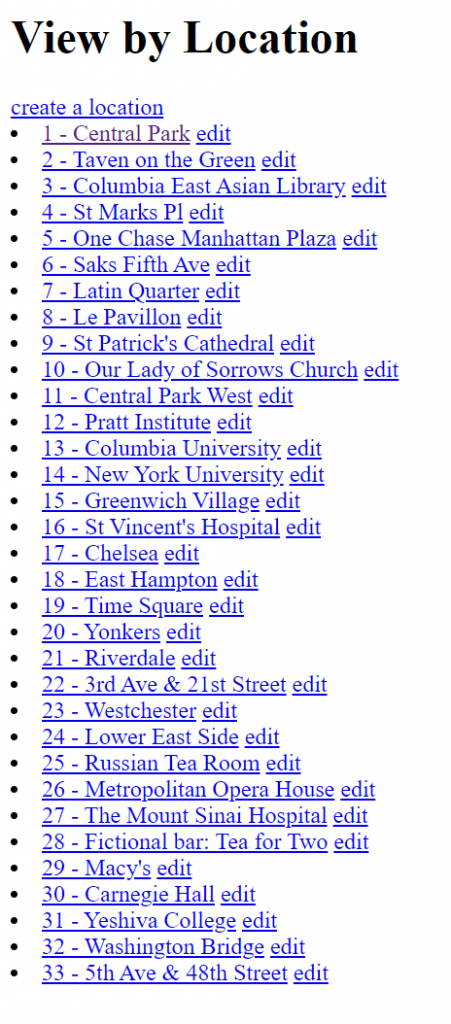
Using javascript, I created a website that indexes the individual chapters and locations, each with pages showing the detail information, relevant quotes, and social media posts (not yet fully implemented).
Leave a Reply