
Who are making phone calls to 311 NYC?
October 9, 2018 - All
Introduction (what is this post about?)
NYC 311 provide the public with quick, easy access to all New York City government services and information.On one hand, NYC 311 helps Agencies improve service delivery, on the other hand, they also provide insight to improve City government through analysis and accurate measurement. This post is one analysis aiming to generate a general picture of NYC 311 service request, using a visualizing tool, Tableau public.
Inspiration(How did I come up with this idea?)
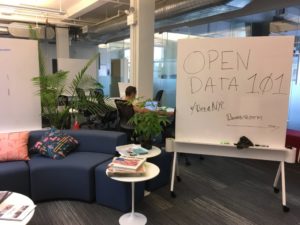
I came across NYC 311 when I was searching for apartment rentals on government website of New York City. Although I did not find my apartment from here, NYC 311 is quite helpful to me. Later at school, when I was looking for an event to attend, I came across NYC open data workshop provided by this community in civic hall on 22nd street. The event went well and you can find all the notes (free) and thoughts here. This event brought the data set of NYC 311 service request in front of me and I carry on with my interest and bring it to this post.
Tools (What have I used to generate this result?)
To generate insights of the question stated in the title of this post, first I need a data set with descriptions of specific service requests. NYC Open Data is a powerful platform that ensures transparency and fosters civic innovation to help improve the quality of life for all New Yorkers. Thanks to NYC Open Data, so that I can grab the data I want easily and openly.
the screenshot of dataset
One more step needed, to process data into information and insights. I used this visualizing tool, Tableau public, to help me with all charts and graphs. The illustrations generated by Tableau are standardized and easy to perceive, with proper color and other customization, it can satisfy much of the needs of visualization. It is an efficient tool.
the screenshot of tableau working file
Interpretation(What does the result mean to everyone?)
Tools smooth the process of insights creation but the critical part in a data analysis and visualization work is to ask good question(s). Sometimes we come across a problem, and we want to solve the problem, thus we have a question in mind, what should I do to solve the problem. In this case, we understand that the goal here is to improve the quality of life of New Yorkers. To some extent, the goal can be interpreted as to minimize the number of service request.
There are multiple agencies who are responsible for this final data; there are also diverse areas where service requests are coming from. In order to have a general picture of 311 service requests, I asked the following questions:
- Which borough is reporting the largest number of 311 service request?
- What type of 311 service request is most reported?
- Which day in a week is most reported?
- What time within a day was complained the most?
- Can I have a map display based on the number of complaint of all the borough?
- Which agencies are receiving most of the requests?
Note: the interpretation of 311 service request is base on data ranging from 00:00:00 of 09/23/2018 to 23:59:59 of 09/30/2018.
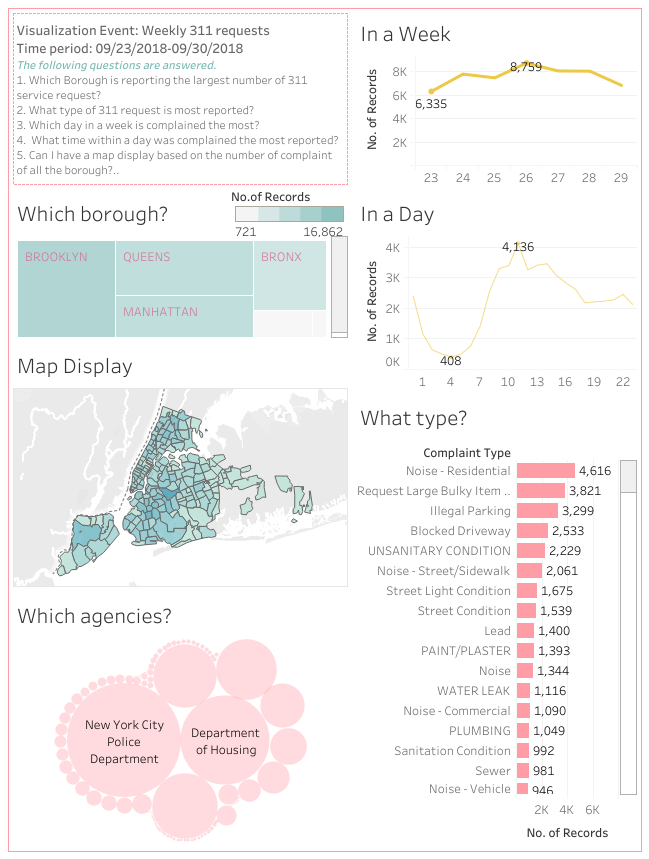
Answer to Q1 Which borough?
Brooklyn.
Answer to Q2 What type?
Noise-Residential.
Answer to Q3 In a Week
Sep.26, Wednesday.
Answer to Q4 In a Day
Around noon.
Answer to Q5 Map Display
As can be seen from the map, Brooklyn seems darker in some areas.
Answer to Q6 Which agencies?
NYPD and Department of Housing.
Reflections(What type of occasion is not covered in this post)
We may know the pattern from this report, but we don’t know the life quality of people who did not make calls to 311. Further research should be delivered here.
Also, people make calls to stop noise because noise is most likely to stop soon? there are much more issues that influencing quality of life, but we are just used to it, so we stop requesting for services.
The post Who are making phone calls to 311 NYC? appeared first on Information Visualization.