Personal and Political Networks
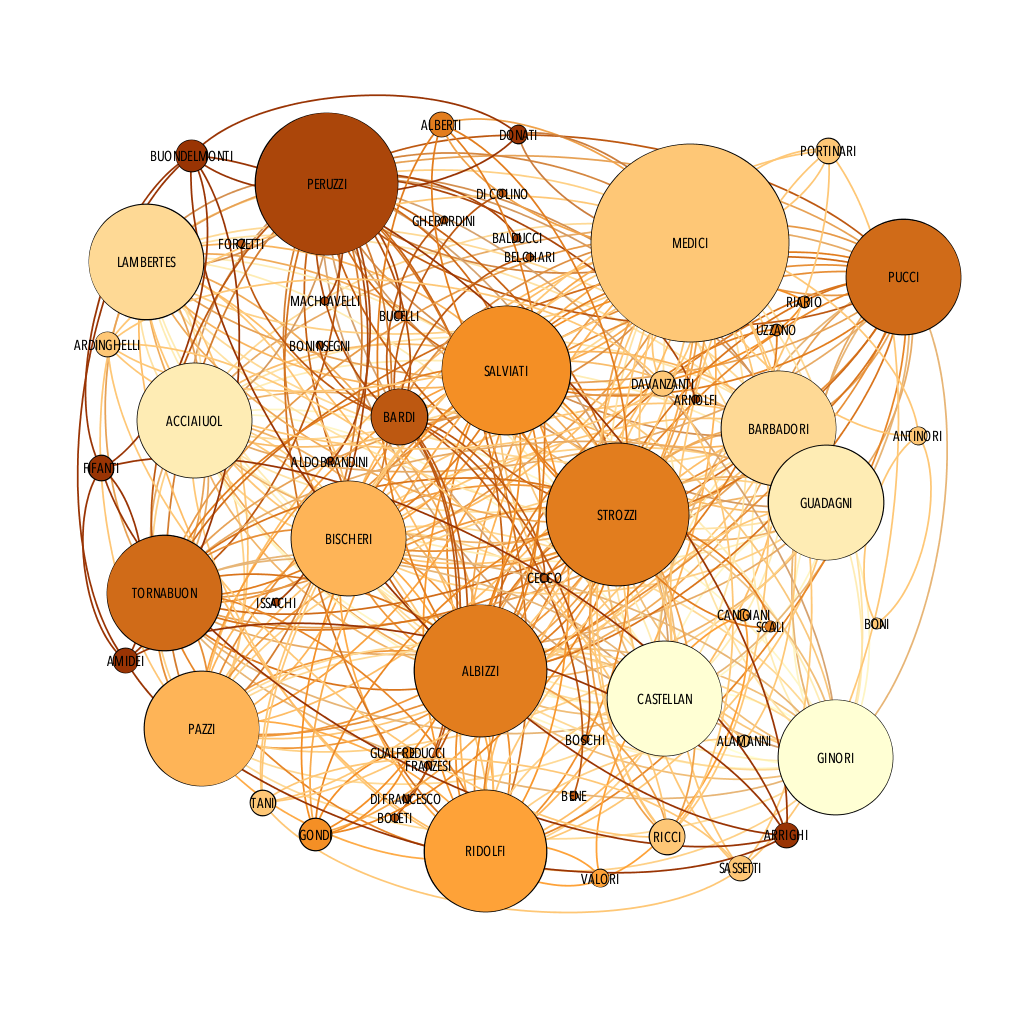
Network Diagram of Influential Families in Florence, Italy during the 14th and 15th centuries.
Introduction
The study of power in Europe during the Early Modern Period (roughly 1350 to 1750) centers on human and institutional relationships. Often, it requires examinations of the public and private connections between people or groups who, by inheritance, conquest, political maneuvering, or economics, held positions of influence in a particular society. While the mechanisms used to exercise power differed from place to place—hereditary monarchy (ruley by a king or queen), oligarchy (rule by a small number of families), plutocracy (rule by the wealthy)—the underlying structure for each of these systems in Early Modern Europe was primarily relationship-based. In short, who you knew or who you were related to mattered when it came to access to power and privilege. One difficulty with studying such interconnections is that they can become entangled very quickly and it is often hard to make sense of the various ties that bind people and groups together. This is especially true when trying to trace connections through texts such as tax records, letters, diaries, proclamations, and guest lists. The major participants (e.g those with the most power and influence) are relatively easy to identify but those in their orbits are often harder to pin down. From the perspective of writing histories, this is a problem because it tends to keep attention focused on those already at the center of power dynamics while ignoring other actors on various social, economic, and political stages. The result is that it becomes all too easy to see a small handful of people as the “prime movers” who were destined to rule a particular place at a particular time. Societies and social systems are rarely this simple so histories written about them should not be either.
One potential way of addressing this problem is to understand the complexity of power dynamics (as a function of interrelationships) by visualizing them in a network graph. To test this approach, I chose to examine the connections between families in the city of Florence, Italy during the fourteenth and fifteenth centuries. I based my efforts on data provided by the historian John Padgett and enriched that data with other sources. Florence is especially attractive as a case study because it is well-documented and also because it was home to the Medici who are famous for having maneuvered local politics to rise from being a family of low-level doctors (as denoted by their name), to being the head of the Florentine Oligarchy, to losing power and being exiled, to finally becoming Grand Dukes of Tuscany in the sixteenth century and intermarrying with European royalty. This means that the city, and its citizens, experienced various forms of governance—oligarchy, “popular rule” during the Medici banishment, and feudal rule by a Duke—each of which was made possible by the relationships between various factions. Florence was also home to a number of well-established families like the Albizzi, the Salviati, and the Pazzi each of which rivaled the Medici and who also were poised to rise to supreme power. The famous Pazzi Conspiracy of 1478, for example, shows how fragile the Medici hold on Florence was and how easily another family could have ascended had the attempt to assassinate Lorenzo de Medici and his brother Guliano succeeded fully (only Guliano died). In addition to these “great” families, there were also others (e.g. the Ginori, the Ricci, the Alberti) who exercised influence in the city and whose allegiances could help or hinder various power plays in local politics. Being able to see the connections between these groups in a visual form helps shed light on just how intertwined and complex they were.
Inspiration
In part, my choice to display the Florentine Family Network data as a “tangled skein” of nodes and edges (as opposed to, say, a tree diagram) was inspired by 2 network graphs.

The first is a visualization of the interconnections among Immigration lobbying efforts. The clustering of nodes into interest groups and the tightly intertwined edges showed how complex and messy such efforts are. I also liked the ways in which the flow and overlap of edges made clear where various pathways of power and influence exist.

The second is a visualization of a network of the most influential Russian politicians. This particular graph shows that the field of politicians with power in Russian politics are fairly evenly balanced among a handful of individuals. Intermixed among these more dominant nodes are individuals with slightly less power and at the edges are those with even less. I found the readability of this graph appealing and I also liked how it shows that Russian politics is not as monolithic as one might think based on news coverage of it.
The Data
The base data were drawn from a dataset provided by the historian John Padgett, which was originally published in 1986. His full dataset includes relationships between families as well as the influence of each based on their fortunes. The dataset available to the public only contains information on relationships between families. The secondary set regarding financial status must be purchased. Working with the family relationships data most directly addressed my underlying questions regarding finding ways of visualizing power dynamics. The absence of the financial portion was not disruptive. The base dataset contained 16 families that accounted for 247 connections. I then enriched this data with research regarding further connections among the families listed. This expanded the families listed to 56 and the connections among them to 350. I gathered the extra data by relying on information found on wikipedia pages as well as other publicly accessible sites. These included, among others, pages on the Medici, the Albizzi, the Salviati, the Pazzi, the Bardi, the Strozzi, and the Alberti.
Methods
The base data set from Padgett is available as an .xml file. To process this, I imported into OpenRefine to parse the .xml file and separate the node list from the edge list. The dataset contains 16 nodes and 514 edges. Half of the edges, 247 of them, are duplicates and would have been used for understanding relationships in regards to financial data, which was not included. The only step necessary to account for this was to remove the duplicate edge list. The data does not assign a unique identifier to the names in the node list but, instead, uses each name as the node designation. I added a column for a unique identifier and then created a new edge list that used the identifier numbers, rather than name strings, to show the source and target relationships required for performing a network analysis.
I then expanded the node list by researching the families listed to find connections not represented in the base data and updated the edge list accordingly. To find the supplemental information, I used wikipedia pages as well as publicly accessible websites. My choice to use wikipedia entries and public websites was two-fold. First, I wanted to quickly trace relationships between families by looking into where they intersected historically. Well-curated websites provide that information in an easy to read format (though it requires physically reading the entry rather than scraping the site to tease out information about relationships). Second, and most importantly, I wanted my expansion of the data to be verifiable by people who do not have access to scholarly materials that are housed in academic libraries or are behind paywalls. The sites I chose were not meant to be exhaustive but, rather, a quick sampling of sources that could extend Padgett’s data beyond the Medici to show how complex the relationships between powerful Florentine families could be.
Once the data was supplemented, I imported the node and edge lists into Gephi, which is specialized software for network analysis. I ran standard network statistics on the data (centrality, modularity, network diameter) using Gephi’s built-in tools. I then chose the Noverlap layout algorithm to order the graph. Once the network’s shape was set, I used data derived from the network’s statistics to style the nodes and edges (e.g. node and edge color, node size, and label size). I set the node sizes to reflect how many connections each had so that the sizes of each would show their proportional importance (i.e. those with more connections are largest). I used modularity to color nodes by communities, and used degree measures to add color to the edges. Finally, I exported the graph as a .png file.
Results
The graph generated from the enriched Florentine Families network data for the fourteenth- and fifteenth-centuries shows multiple entanglements between various factions, large and small. The visualization shows that the Medici were important but not necessarily as dominant as Medici-centered histories of Florence might imply. This reflects the reality of the period under study. The Medici were powerful but the Pazzi Conspiracy almost destroyed them. Even after surviving it, taking vengeance on their enemies, and consolidating power further, the Medici were still vulnerable enough that they could be, and were, sent into exile from 1494-1512. In other words, visualizing the interconnections between influential families in Florence provides an interesting corrective to the dominant impression that we have about the Medici.
Future Directions
The list of families and interconnections used to create this graph is incomplete. Padget’s dataset was focused on the inner core of the most influential Florentine families but left out older, albeit less powerful, families such as the Alberti and the Boni. It also discounts the influence of powerful families outside Florence, like the Sforza of Milan, who covertly and overtly interfered with power and politics in the city on an ongoing basis through their own personal interconnections. A more robust list of families, including influential parties from outside Florence, would provide a more detailed picture of power relations in the period. It would also be interesting to track and classify the quality of relationships between families across time. The Medici and the Pazzi, for example, had been long-term allies and had even intermarried before the conspiracy. In the 1470s, this changed and those ties of friendship broke in a spectacular manner. Being able to show the changing interrelations among friends, enemies, and associates of convenience on a yearly basis would provide even more nuance to our understanding of how power was formed and exercised.