Information Visualization

Student work at the School of Information, Pratt Institute

Menu

Skip to content
  • Final Projects
  • Lab Reports
    • Charts & Graphs
    • Maps
    • Networks
    • Timelines
  • About
  • |
  • Login
  • Help

Author: dfrank13

Once Upon a Graph; Mapping the Once Upon a Time Family Tree

dfrank13

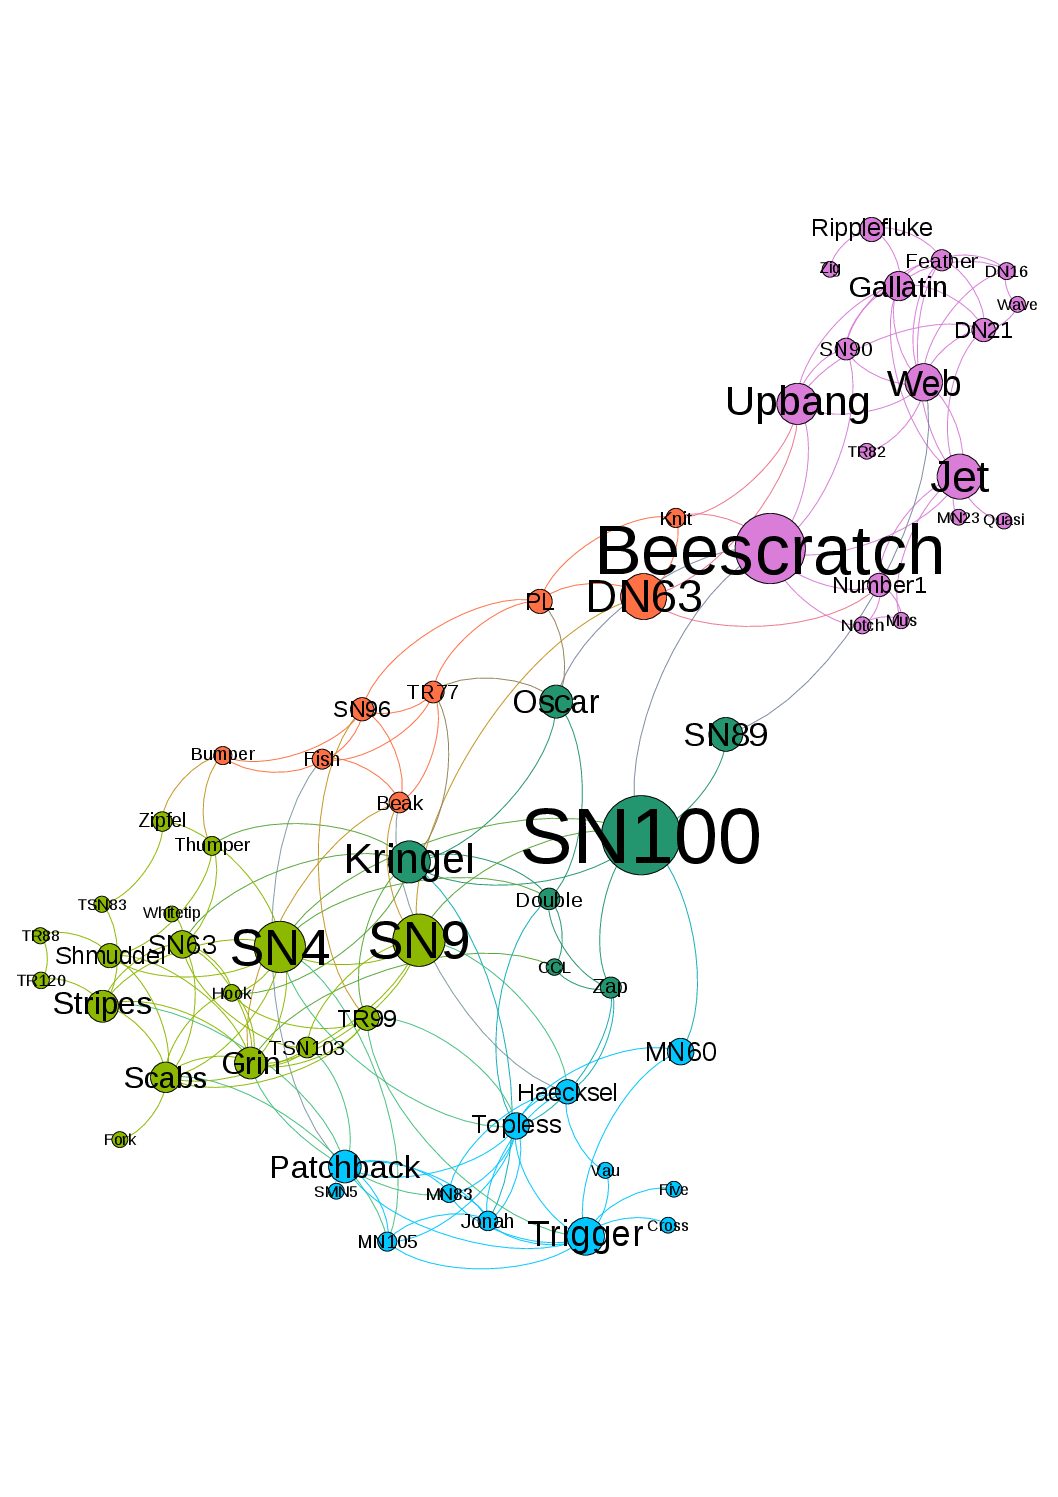
Mapping the social structure of dolphins using Gephi

dfrank13

Museum Density in New York City

dfrank13

Rubin Museum Twitter Analytics

dfrank13
Widgets

Topics

#Gephi #Network Visualization art bar chart carto cartodb Cartography Charts & Graphs choropleth covid-19 data visualization Data Viz final projects gender geospatial Gephi GIS history information visualization Info Viz interactive map lab report lab reports line graph map mapping maps museums network Network Analysis network graphs networks network visualization New York new york city NYC NYC Open Data openrefine QGIS social network tableau Tableau Public timeline timelinejs TimelineJS Visualization Visualization

Search

Proudly powered by WordPress | Theme: Illustratr by WordPress.com.