Gephi Lab: A 19th Century The Social Network
April 18, 2018 - All
Intro
I have chosen to represent one of the original documentations of a social network, created in Germany by the teacher Johannes Delitsch of an all boys 4th grade class in 1880/81. Delitsch documented the social connections and relationships between the 53 boys in his class, “he wanted to understand why and between whom friendship relations form” (Heidler et al., 3). As a result of the data collected by Delitsch I was able to present the data now 140 years old, through a digital lense forming a visualization of a true social network.
Materials
- Gephi 0.9.1
- Class of 1880/81 data
- Richard Heidler, Markus Gamper, Andreas Herz, Florian Eßer. “Relationship patterns in the 19th century: The friendship network in a German boys’ school class from 1880 to 1881 revisited”.Social Networks. (Volume 37, 2014). Pages 1-13. Retrieved from https://doi.org/10.1016/j.socnet.2013.11.001.
Methods
I chose the dataset due to its simplicity but also its history. I chose to represent data and people who are no longer here by recreating their social interactions. Once the data was in Gephi I drew on inspirations that helped me visualize what the original social network would have looked like. I was inspired by different types of networks for their design and understanding of what I could create with my data.

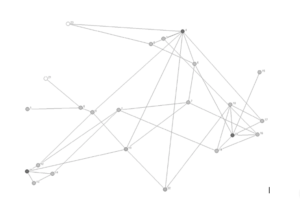
Fig 1. Network showing a gradient shading of nodes
Figure 1s network design inspired the use of gradient color in my network by representing the number of connections on a single node by a darker color. The gradient I chose for my network was purple, a color that is neither negative nor positive but a representation of a difference amongst equals. The darker the purple node and edge the more connections that individual has with another classmate as you can see in Figures 4 & 5.
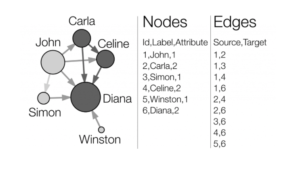
Fig 2. How a small directed network of nodes and edges is created
To understand how my data was set up to create a network Figure 2 helped me understand on the most basic level how a small network is created. Each member of the class is a node, a source of social friendship, connected to a target. The more a target is sourced the more connections are represented by color and edges. What I did not use as inspiration from Figure 2 was the size of the nodes. In the network I created (Figure 4) the nodes are individuals in a single classroom. Creating a difference in size of the nodes would not have represented the data truthfully.
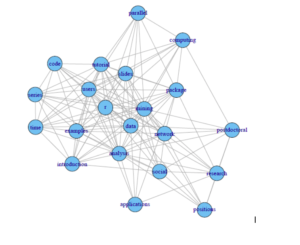
Fig 3. Unlayered nodes make sure the data can be read clearly
I was further inspired to create my network from Figure 3s representation of unlayered nodes. There were 53 individuals in the class, a large class but a small network of nodes. I wanted to make sure that each edge and node could be seen. I chose to adjust the gravity of the network to allow for the nodes to separate while making sure layering did not occur. What I needed to adjust were the isolates that were rather far away from the central network. I brought them closer to the network as seen in Figure 4, so that it is understood they are not connected but are part of the class.
Results & Description
The results of the data being in Gephi creates an image of a social network created over a hundred years ago. Each node represents an individual who was recorded in the original data, connected by an edge to another or many individuals. The darkers the color of the node and edge means that individual has many social social relationships with many people. The opposite is true for the lighter colored nodes. There are 5 isolates that are on the outside of the network, meaning sadly they did not have many social connections documented. I chose to represent the amount of connections as a gradient because it is not a question of do they or do they not have friends, the observations, talks and writings made by Delitsch did not yield high results for those individuals. I included labels for each node to distinguish between the different students, although the names do not mean anything to us in the present we can relate them to the descriptions in the article the data derived from. I attempted to create an interactive network for a viewer to hover and see one set of connections at a time between one individual and their many friendships. The interactive ability was not successful after attempting to add my network folder to mysite.pratt.edu. I found that the data had non english characters within it, which may have caused the network site to fail. Figures 4,5 & 6 are representations of the network I created which I will include as a PDF as well.
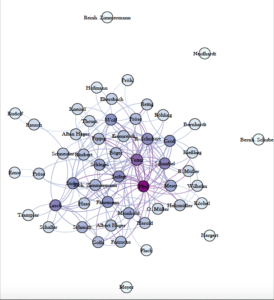
Fig 4. A network created of the social network of a German all boys 4th grade class in 1880/81
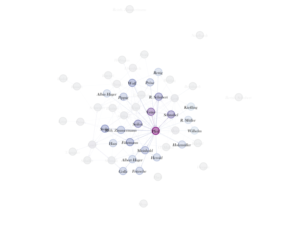
Fig 5. The most connected individual of the class was Pfeil


Fig 6. Isolates, Reinh Zimmerman, Hergert, Meyer, Bernh Schube and Neidhardt
PDF: class of 1880 social network
Future Direction
I would like to look further into who the isolates were and why. In this case I would look at the history of Germany society at the time of the experiment in the 1880s. Focusing on what was occuring socially, politically and economically, maybe there is a clue as to why particular individuals became isolates in this network. The ways in which students were ranked in the 19th century based on mental achievements and popularity, could not be done today. I am skeptical of the ethics and practicality of the original hypothesis working within today’s societal norms, but what could we learn? I would be interested in understanding the social networks without the internet that are upheld within and outside of schools in our modern age.
Resource:
- Richard Heidler, Markus Gamper, Andreas Herz, Florian Eßer. “Relationship patterns in the 19th century: The friendship network in a German boys’ school class from 1880 to 1881 revisited”.Social Networks. (Volume 37, 2014). Pages 1-13. Retrieved from https://doi.org/10.1016/j.socnet.2013.11.001.
The post Gephi Lab: A 19th Century The Social Network appeared first on Information Visualization.