Introduction
Transportation is one of the most essential activities in modern life. It contributes to the intersection of people and regions. In the process of conducting such activity, mistakes might occur and accidents might happen. In this project, building upon a dataset documenting all the vehicle collisions happened in 2013 to 2018, I intend to look into the location, time, vehicles, fatalities in a vehicle collision to figure out if there is any tip we can take from the data to keep ourselves safe.
Critique
This study is inspired by a similar study conducted on traffic accidents by Susan Li two years ago. She focused on the major cause of fatality, which turns out to be driving after alcohol consumption on Friday and Saturday late night. This study dug really deep into the data came up with a very convincing conclusion. However, one thing missing from this is study is a comparison to regular drivings. Through people generally understand it is extremely dangerous to drive when intoxicated, it is more effective, to have a percentage imprinted in the memory for people to readjust their behavior when necessary.
Materials
DataSet: the data set comes from NYC opendata, it is recorded by NYPD through the years
Tableau: Visualizations are conducted using Tableau Public, a free visualization toolOpenRefine: The dataset is cleaned using OpenRefine, a Google originated opensource data cleaning and manipulation tool
Methods
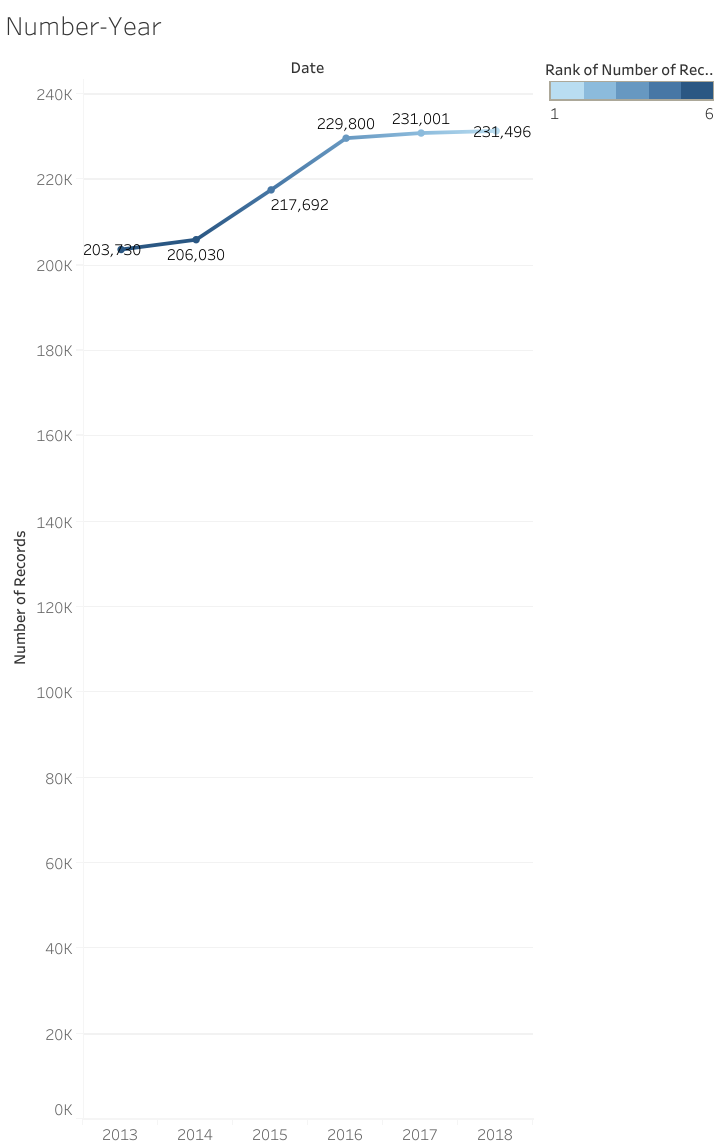
I first present the total number of records against years in order to see how is the number developed over the years.
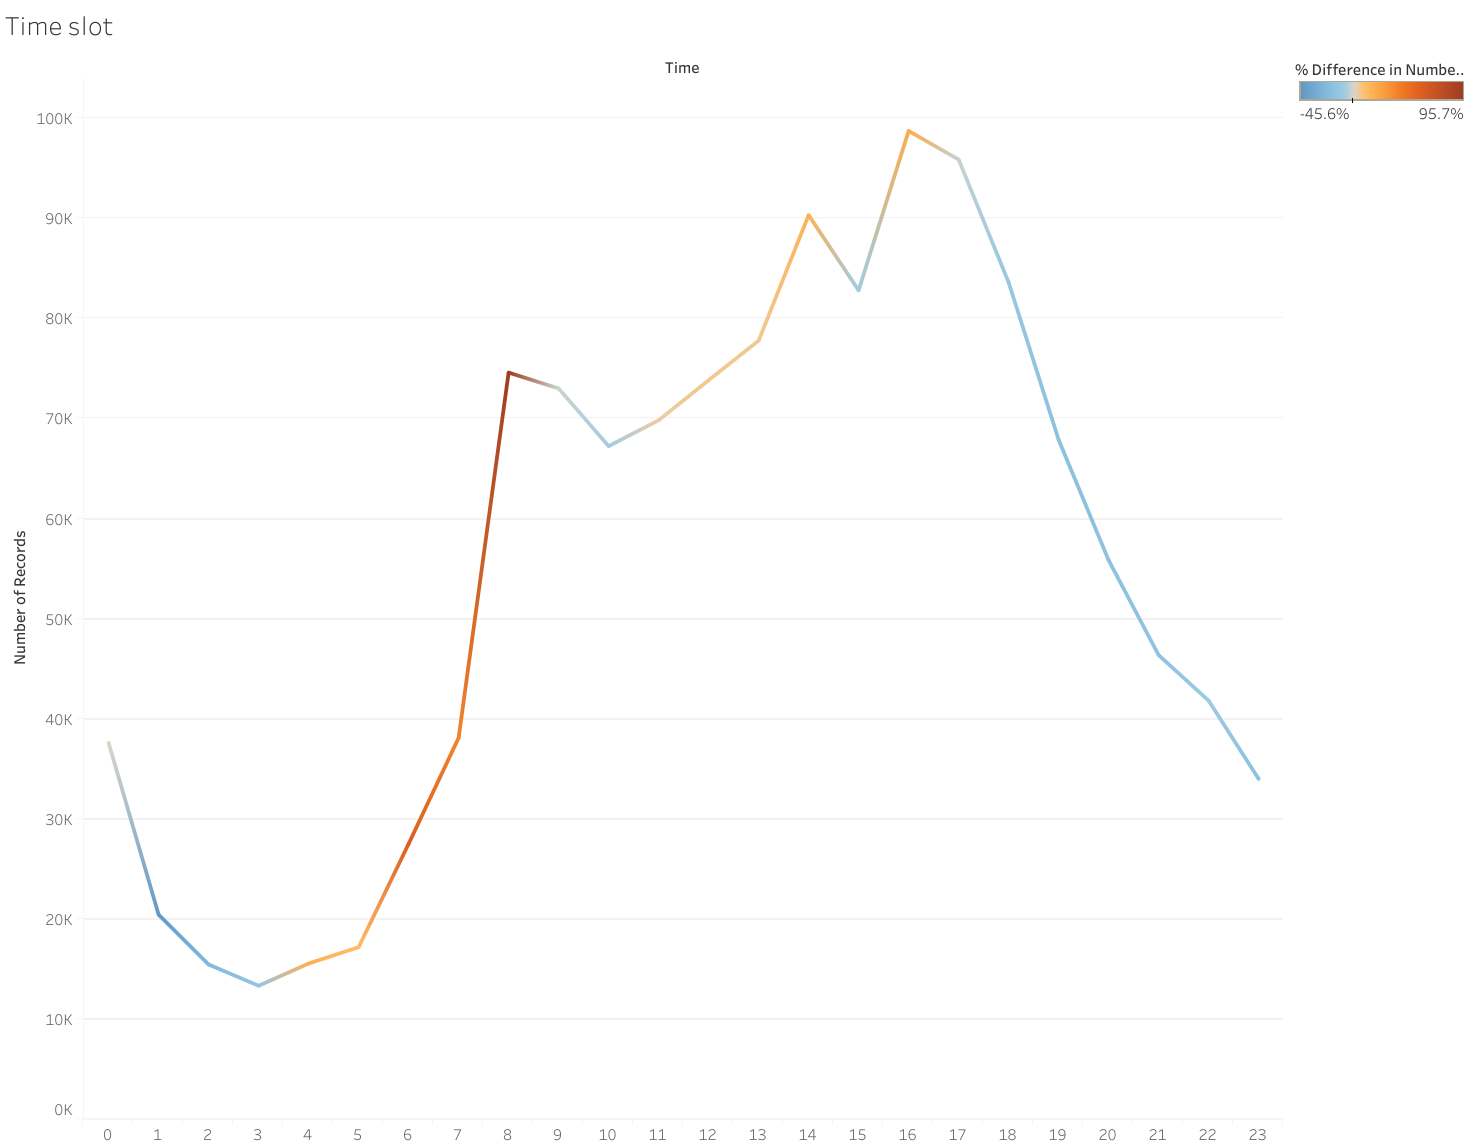
And I also present the number of accident at different time slot during the day to see its tendency.
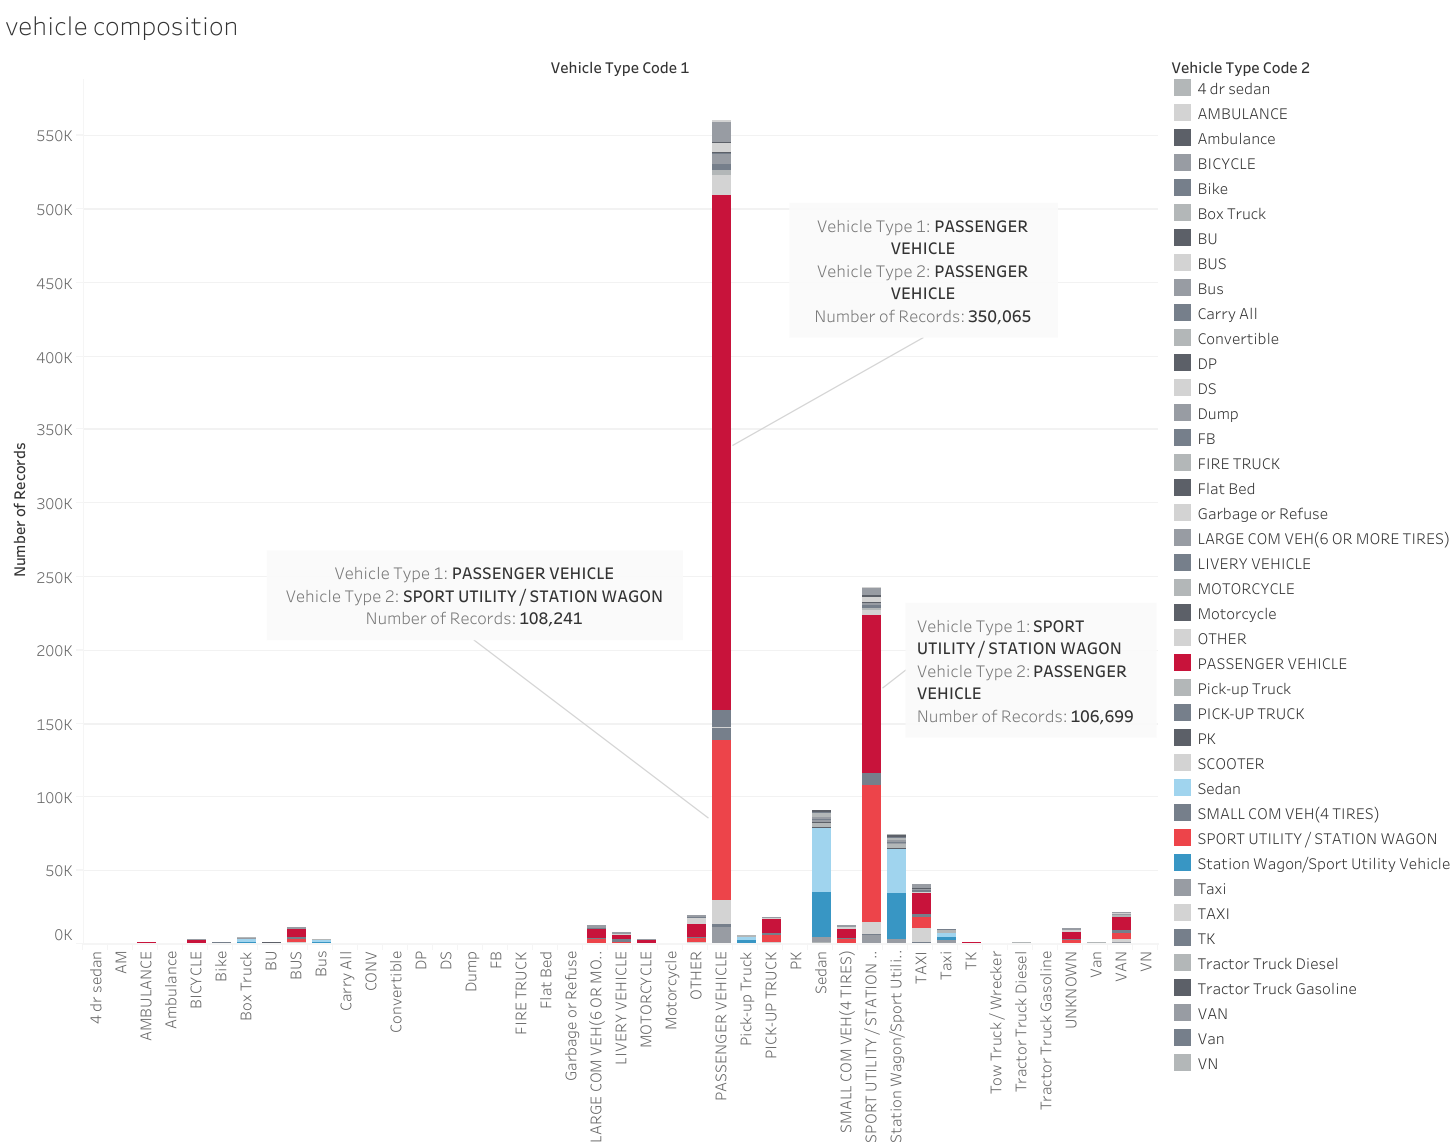
Beside chronological elements, it is interesting to see the break down of the numbers. I first focused on vehicle types.
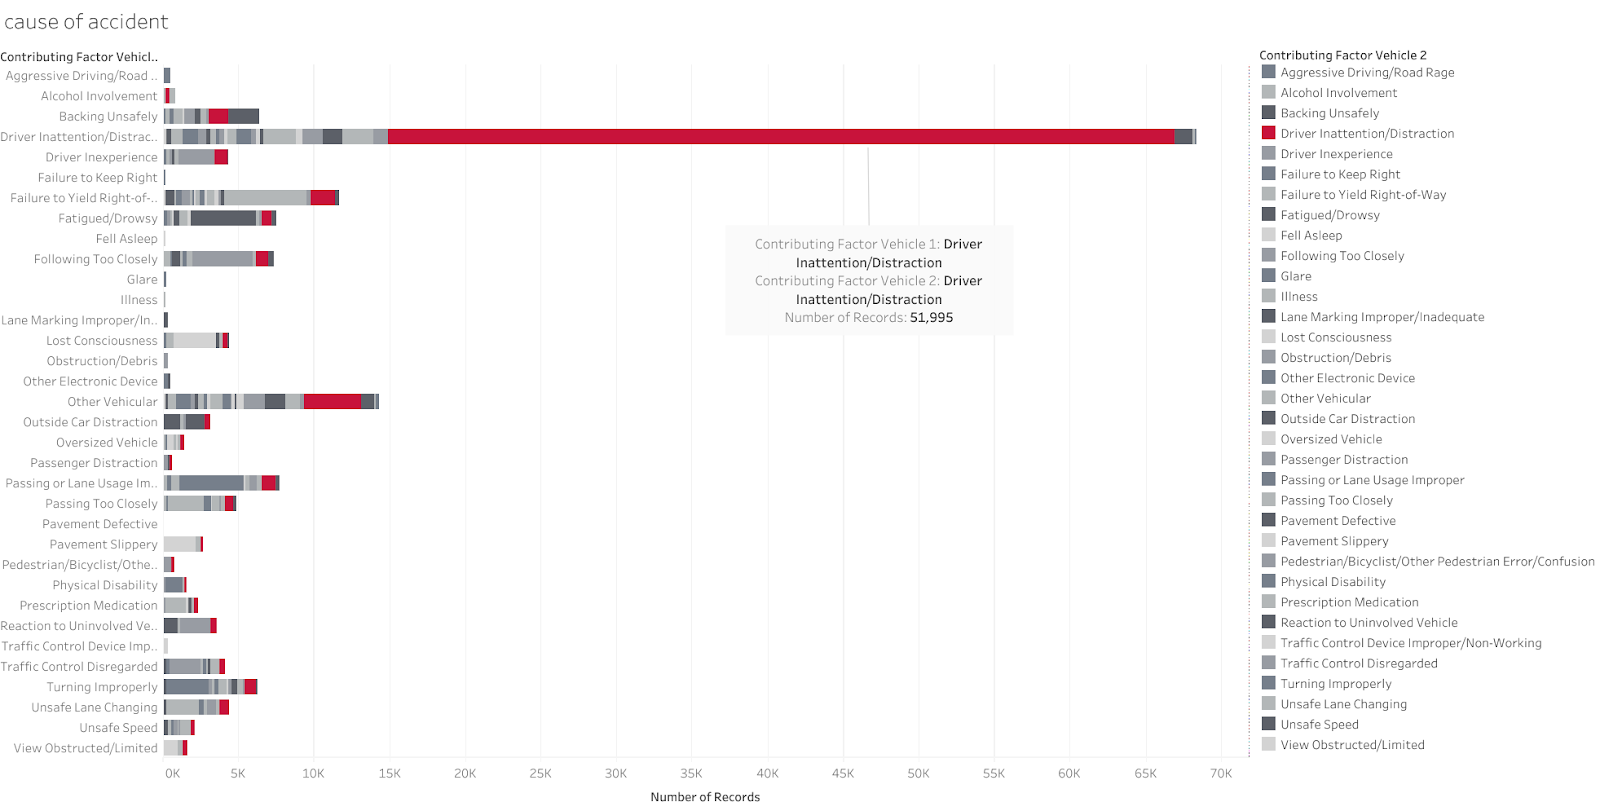
And then I looked into the cause of accidents.
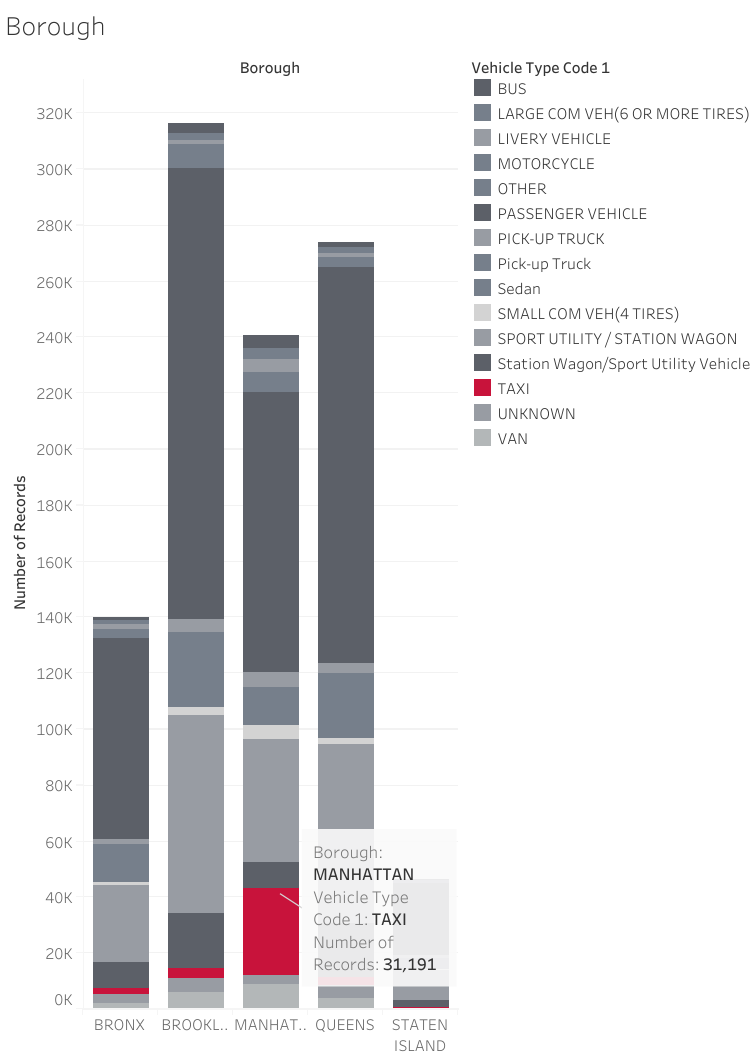
I also looked at how accidents are distributed in different boroughs.
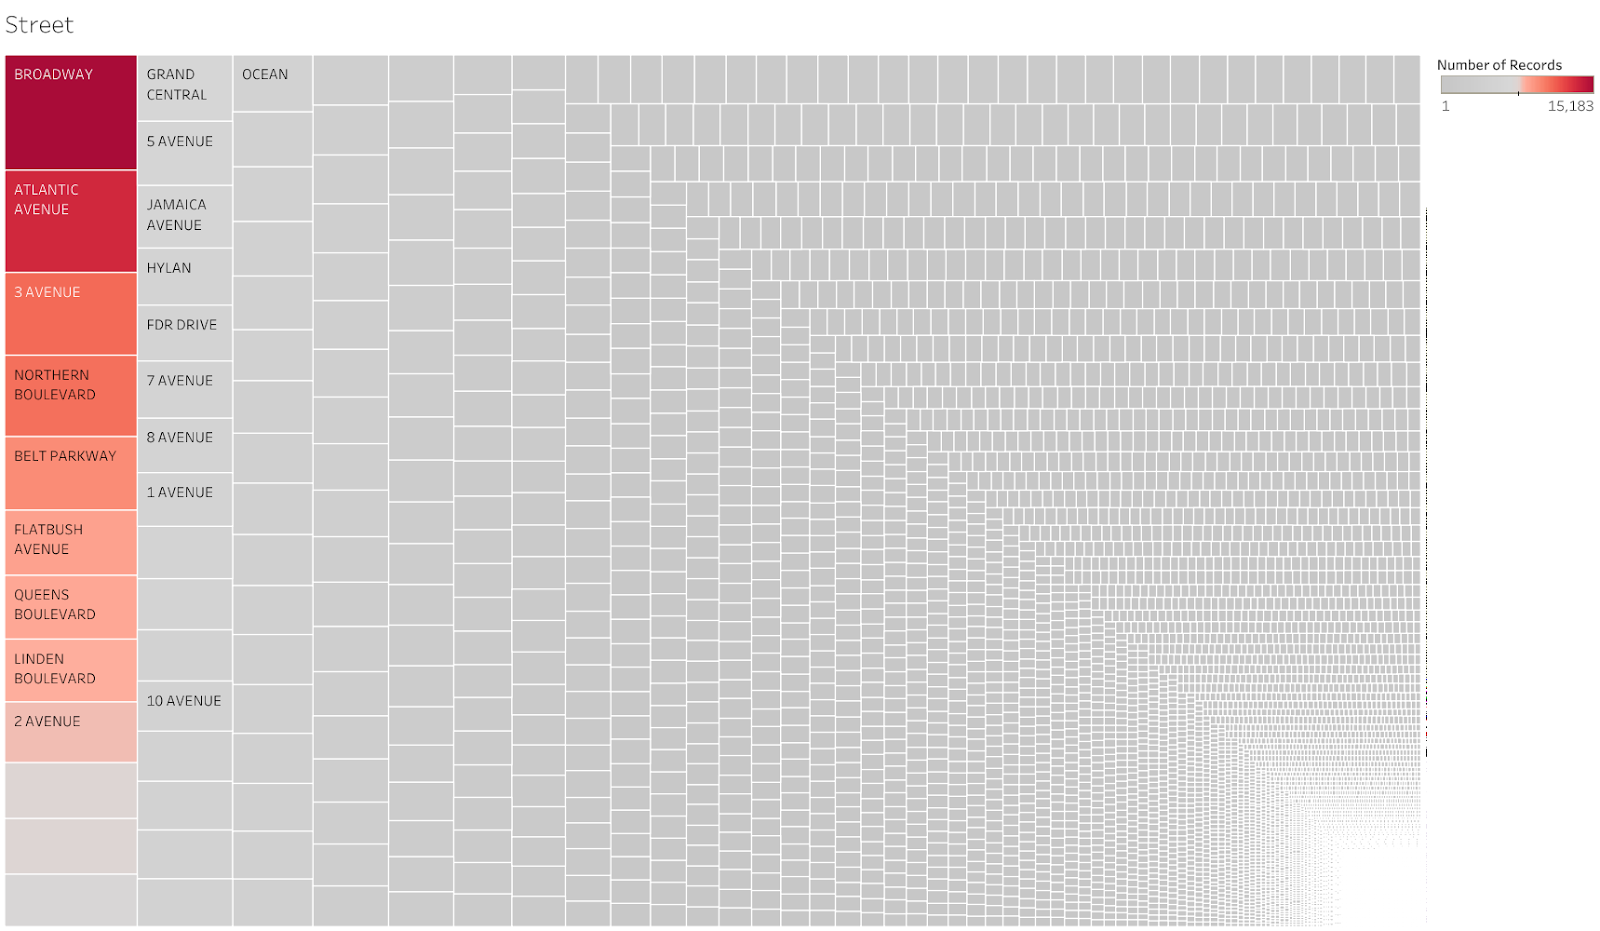
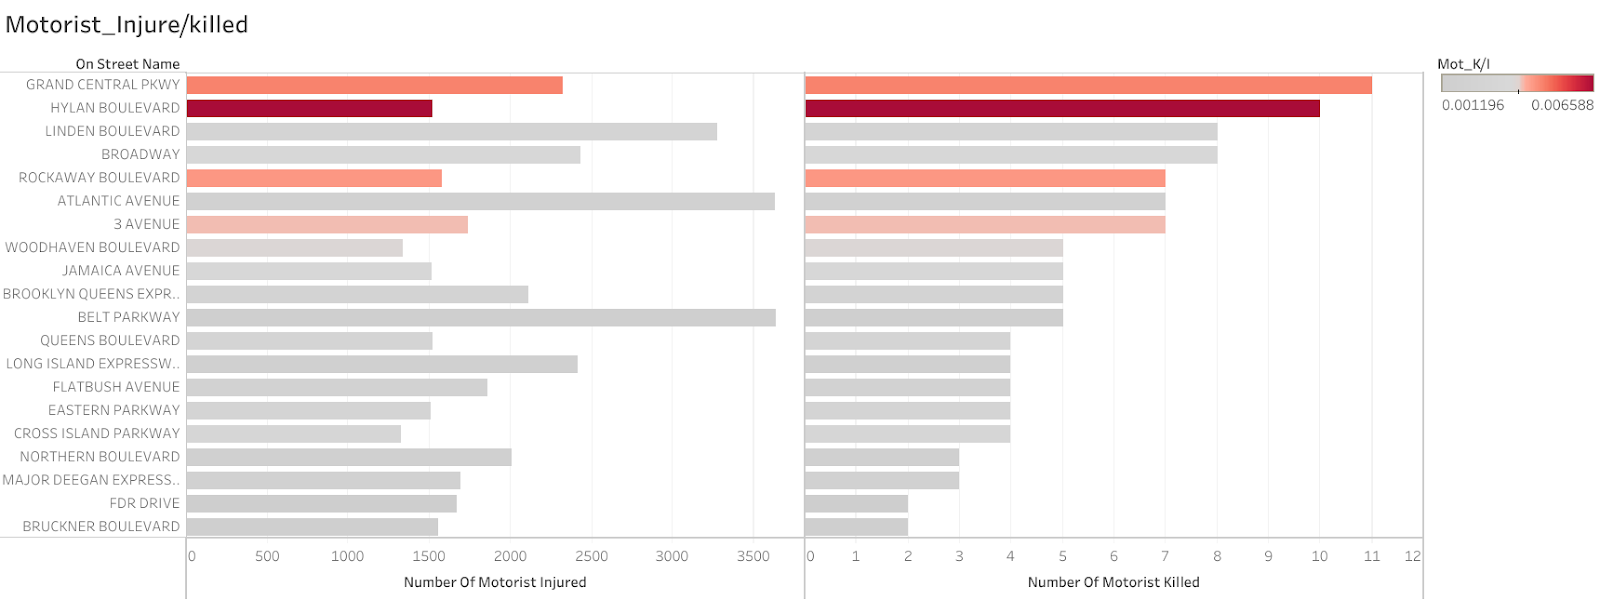
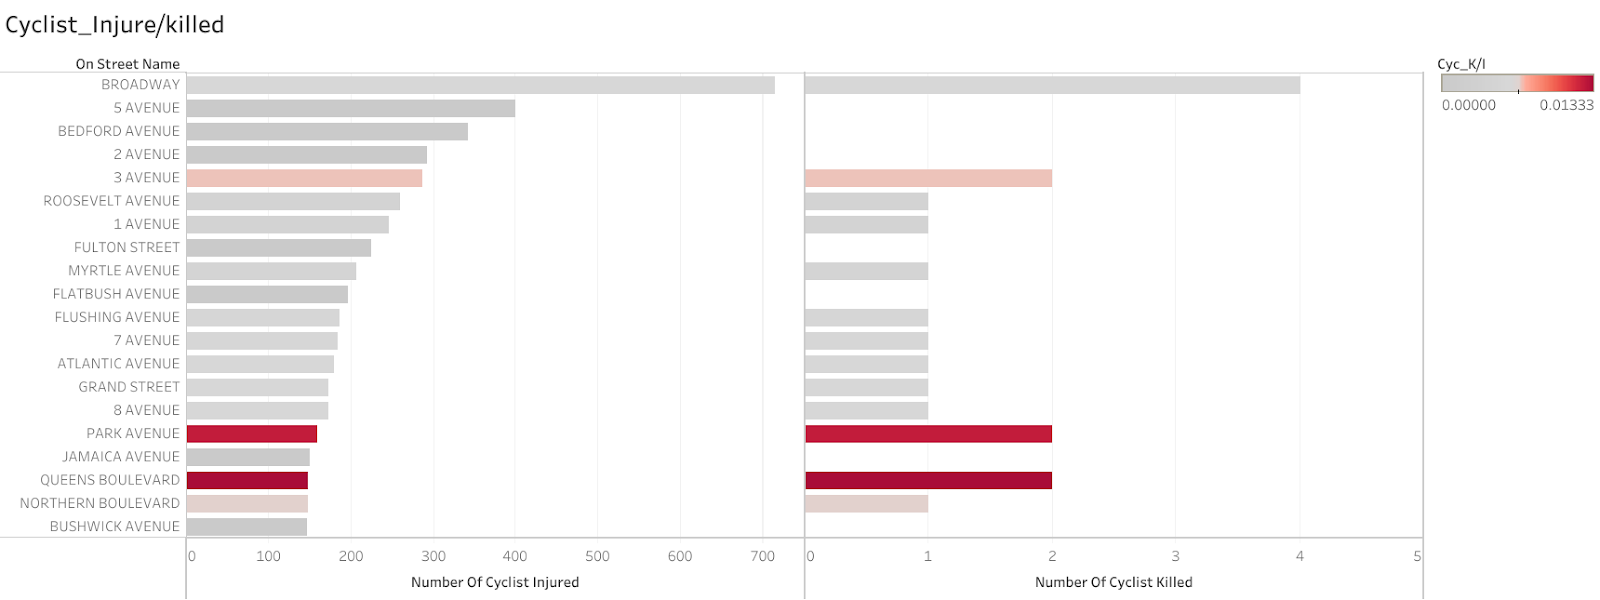
Beyond these, I am also interested in knowing if there is a street more dangerous than others.
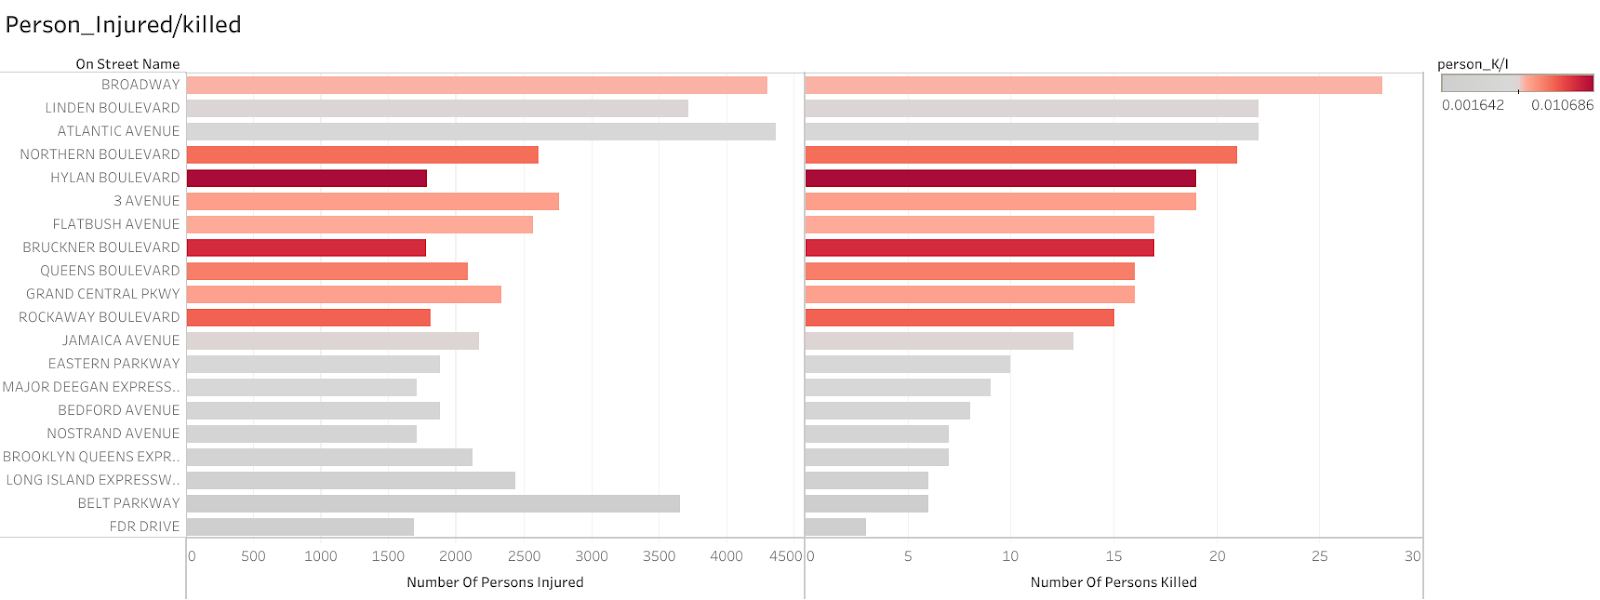
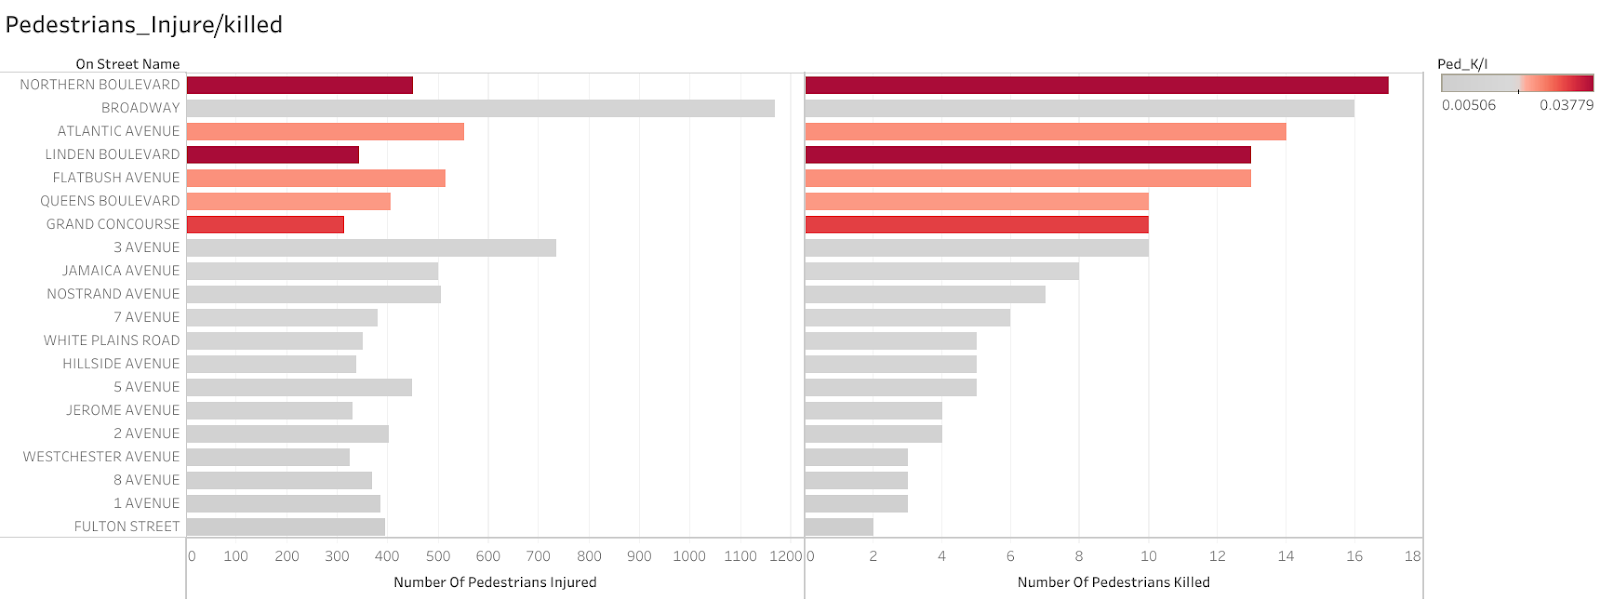
I look at the injure/kill rate of cyclists, motorists, pedestrians and persons in general, and marked the percentage from dark to light
Results and Interpretation
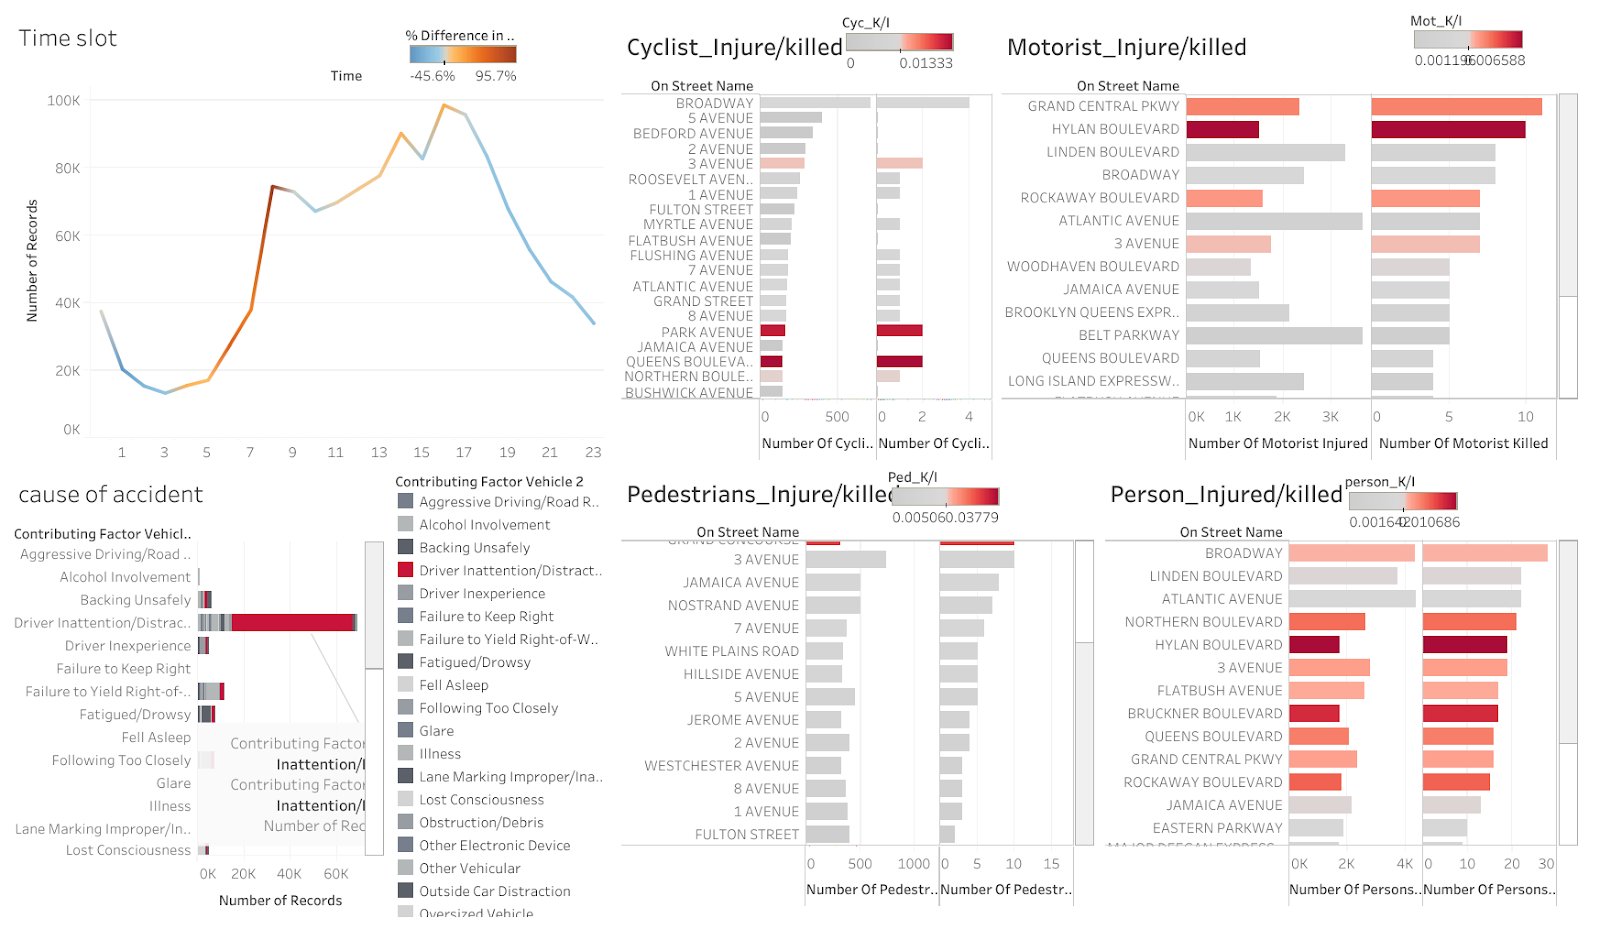
According to the graphs, the total number of accidents increased by 10% from 2014 to 2016. Most often, accidents happen during the day, from 8 am to 5 pm. The peak is at 4 pm. Passenger vehicles caused the most accident. The most frequent reason for an accident is driver inattention, especially when both drivers are not paying attention.
Most accidents happen on Broadway, but it is not the most fatal road of all. In general, on Hylan Boulevard, an accident is more likely to kill a person; Northern Boulevard is most fatal to a pedestrian; Hylan Boulevard is fatal to a motorist, and Queens Boulevard is risky to a cyclist.
Such a study indicate a general trend and pattern in vehicle accidents happen in New York. To a great extent, it is a matter of proportion, the more cars there are, the more often an accident will happen. However, there are street more fatal than others, which indicates the potential of a better design.
Reflection
This study is a peek into the pattern of New York vehicles. Further research can certainly be conducted in a similar direction, integrating more categories at the same time for greater insight. For example, if there is a correlation with certain events; if there is concentration on a certain area, etc.