Introduction:
Do you have an impression about food in Manhattan? Alternatively, if you would like to find some great Chinese food, where would you probably look for? You may not know every type of cuisine, but you may know one or two. My map is a combination of those cuisine data and subjective impression in Manhattan. It great and useful for New York tourists when they are looking for some awesome food or get a rough direction of what cuisine to look for. For those local people or New Yorker, take it as a fun fact about New York and have some relaxing time.
For my goal, I want to make people feel curious about it and trigger them to explore it. Maybe not spend 10 minutes, but just get some information and say:”Oh, that is so true!” Also, I want it to be useful for NYC tourists or people living in New York. They could use it as a food guide. The scenario would be that they check my map when they hang around some area and get the direction or inspiration to find food cuisine. Thirdly, I wish all people could use this map as a part of the culture of New York and enjoy it.
Inspiration:
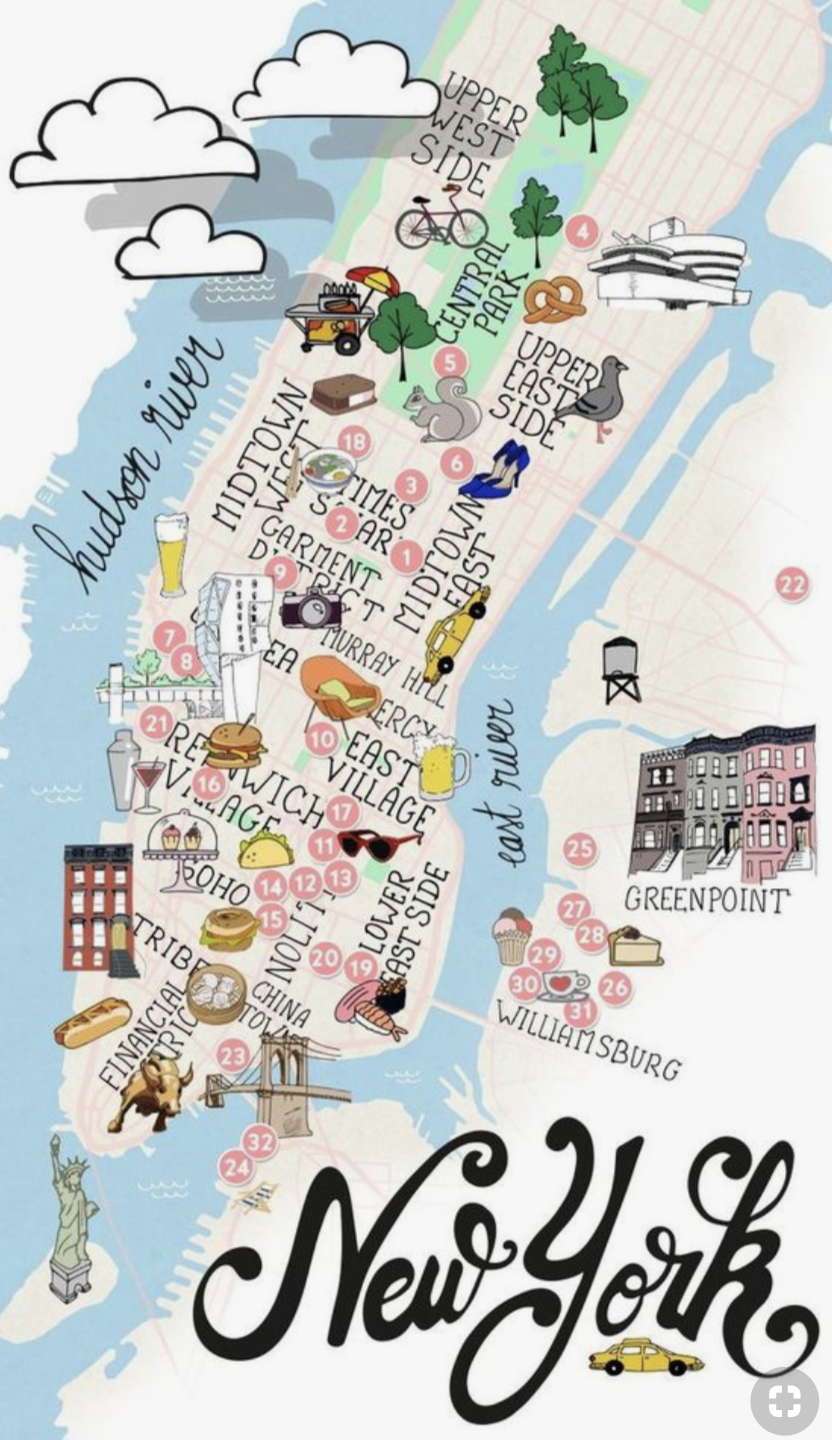
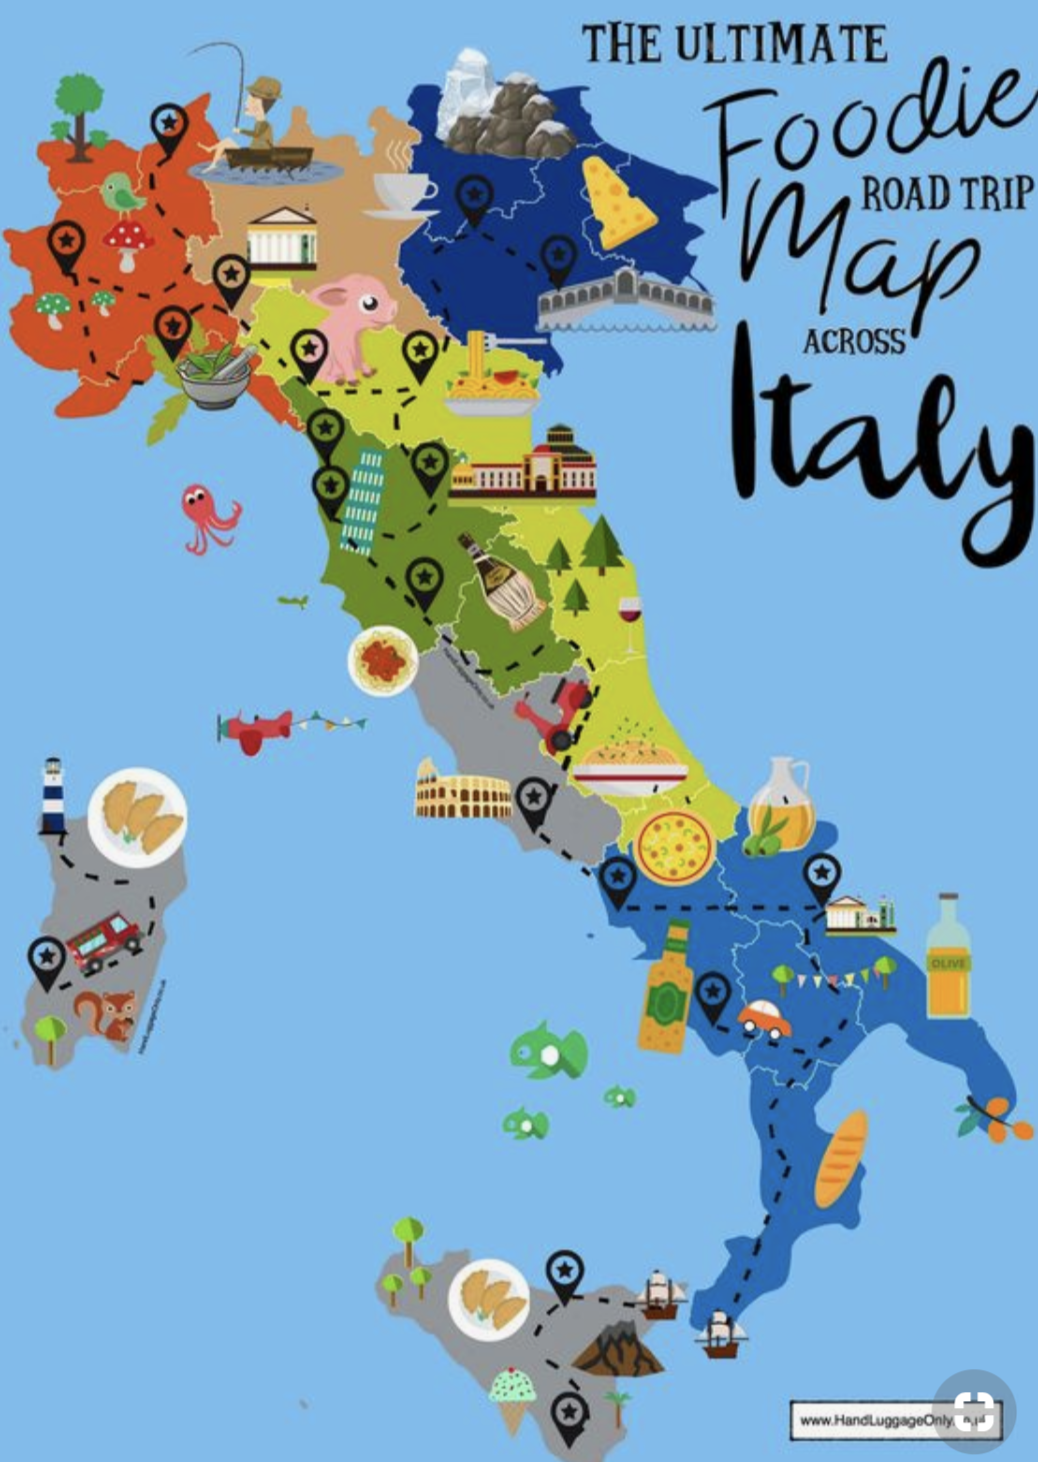
I always obsessed in cartoon map like the img 1&2 below. Maybe they are not as professional as those cool and complicated maps, but at least for me, they trigger my interests and let me explore and want to get the meanings of every icon. I have seen a very impressive map about New York people’s distribution. Unfortunately, I could not find it, but all hipsters in the NYU area leave me a deep impression. I have to say, those cartoon maps are not 100 percent objective, but there is no doubt that they are very user-friendly.
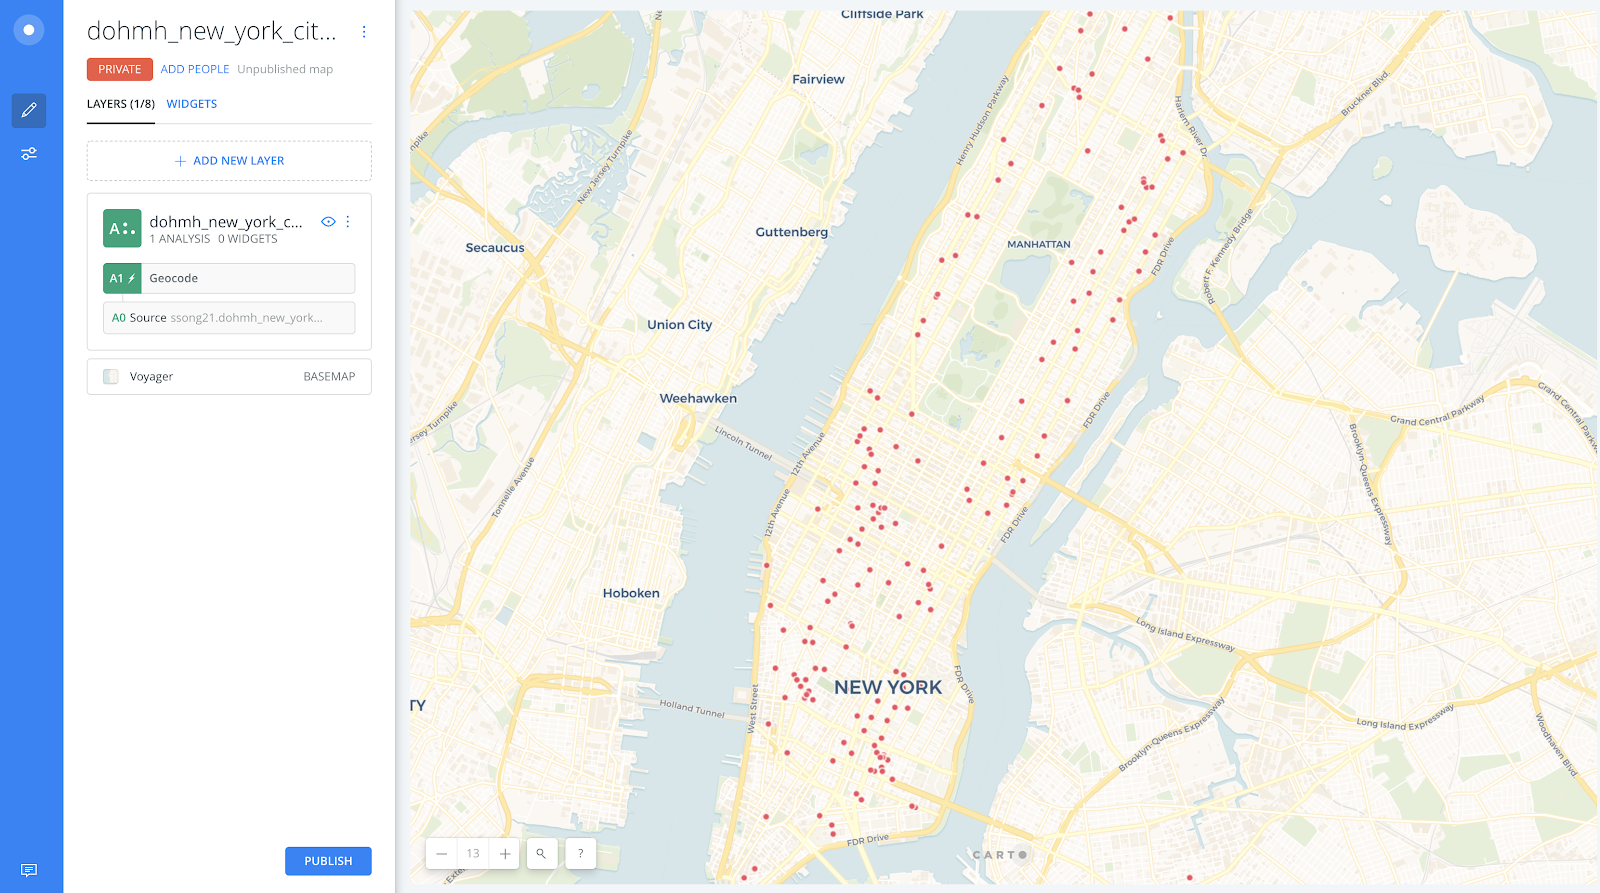
Also, this is a dead idea in my Carto’s Lab work. I tried to build a food map in New York at that time, but the more than 380,000 data and failure in decoding hit me greatly. Even I found that Carto could decode those address to longitude and latitude itself, but the 5000 data limitation makes me only keep the Pizza data in Manhattan. Img 3 below is the Pizza map. As you can see, there is no obvious trending except that downtown has more stores than midtown. Therefore, I gave up. However, the idea is staying in my mind, so I decided to start over.
Materials:
- OpenRefine: effectively and quickly help me clean all data and no potential purchase(for me).
- Tableau: build charts and maps, very functional and easy to use.
- Goodnotes: draw sketches.
- Procreate: draw cartoon map here, tons of layers and time-lapse video are excellent.
Process:
Data clean:
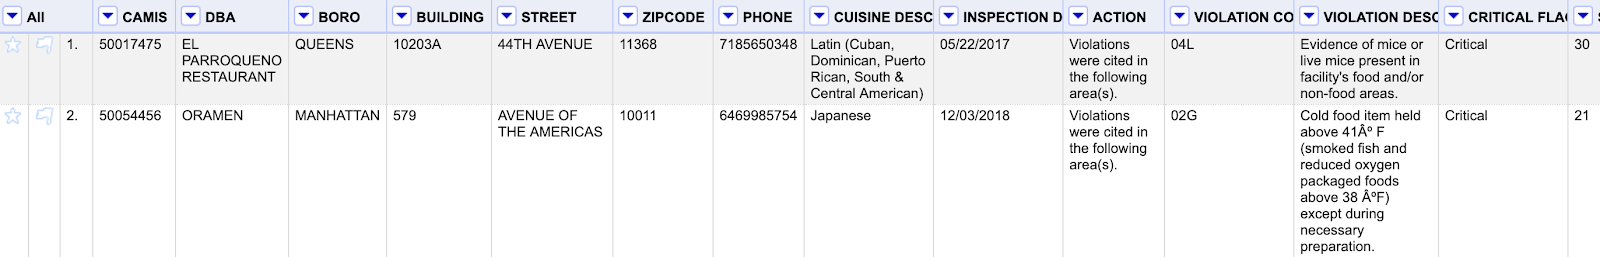
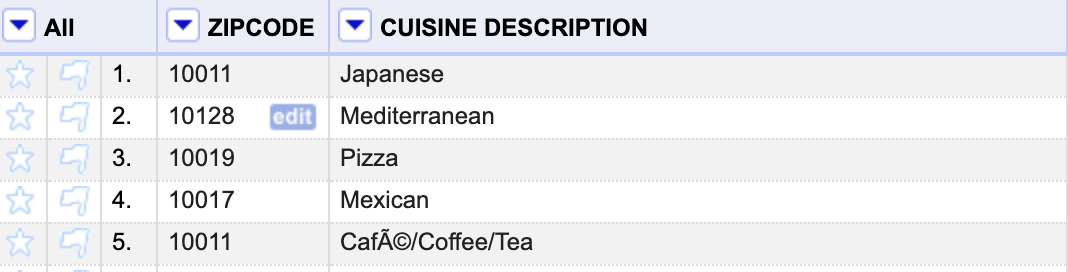
I forget where to get this data due to I use the data I found in Carto’s work, but I am sure that it is not from NYC Open Data. The data are more than 380,000 items and more than 20 columns. Also only address, city, state and zip code there. When I was struggling at decoding them to longitude and latitude, PhD Sula delighted me that I did not even need to. I wanted a map decided by at least neighborhood. In that way, only zip code and cuisine description(cuisine type) are all data I needed. Also, I only keep the data in Manhattan, so that I only had about 180,000 data.
Build map in Tableau:
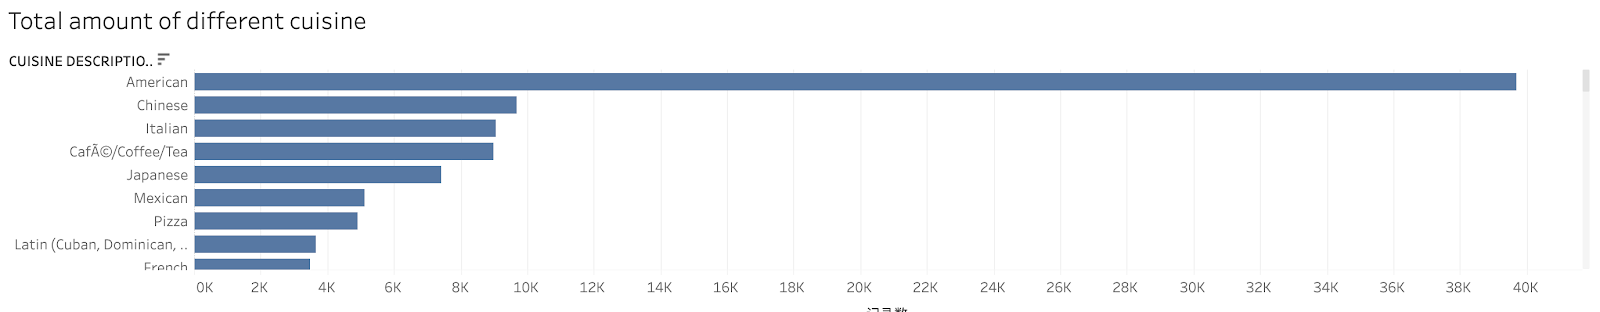
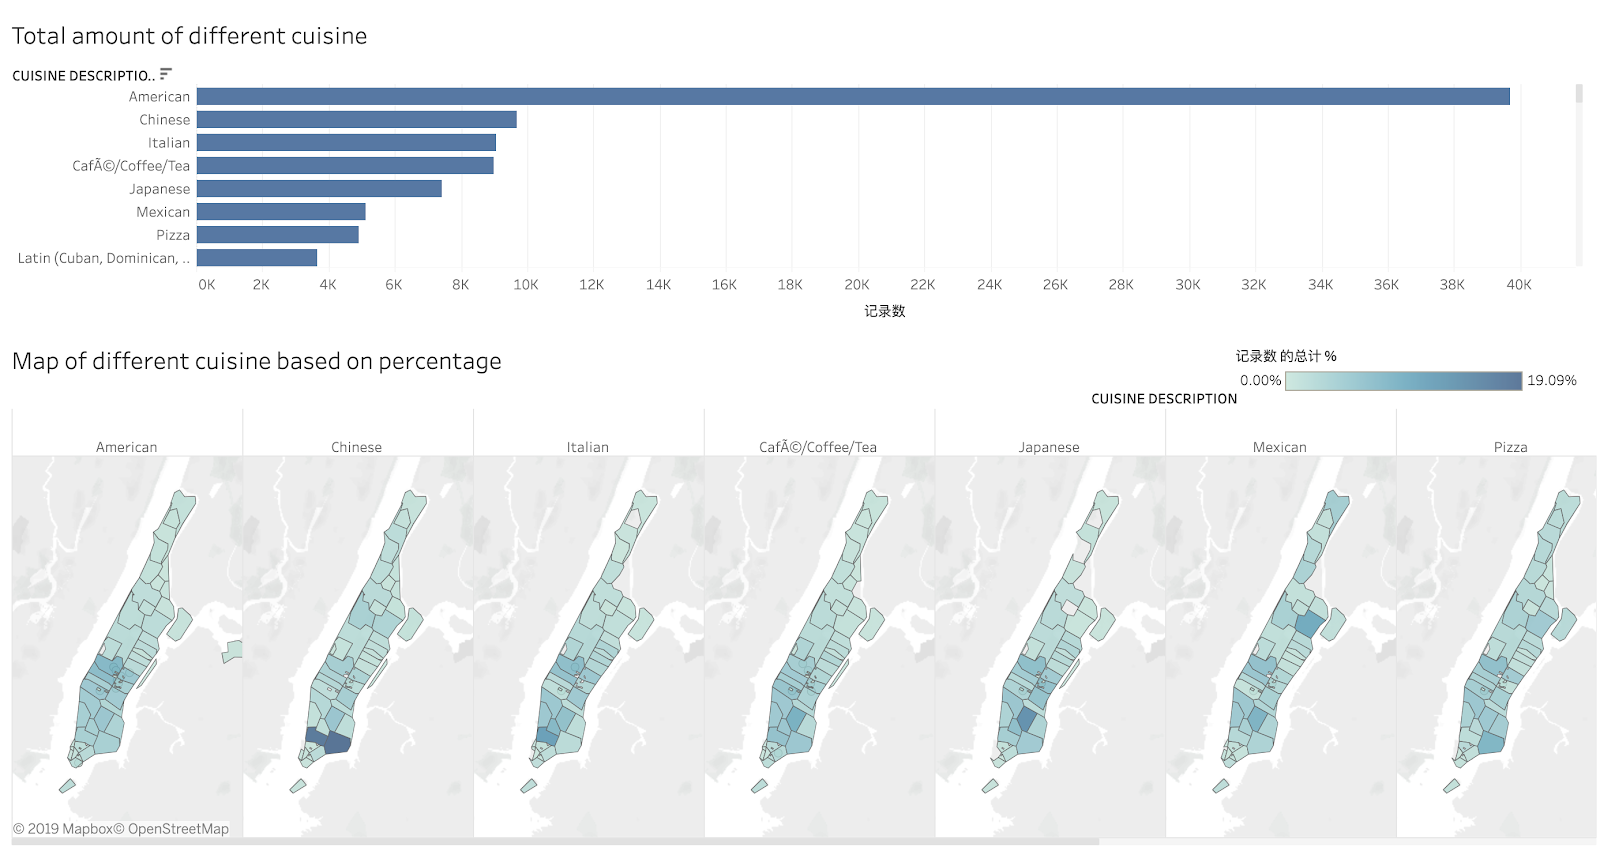
- Make a whole neighborhood map of Manhattan and only show the cuisine which has the biggest number: technically it could, but I faced the problem that I never thought about. Almost every neighborhood showed American food. After making the total number chart of data, I found that American food’s total number is five times than the second cuisine Chinese food. That did make sense because almost all fast food and junk food belong to American food. They are truly everywhere.
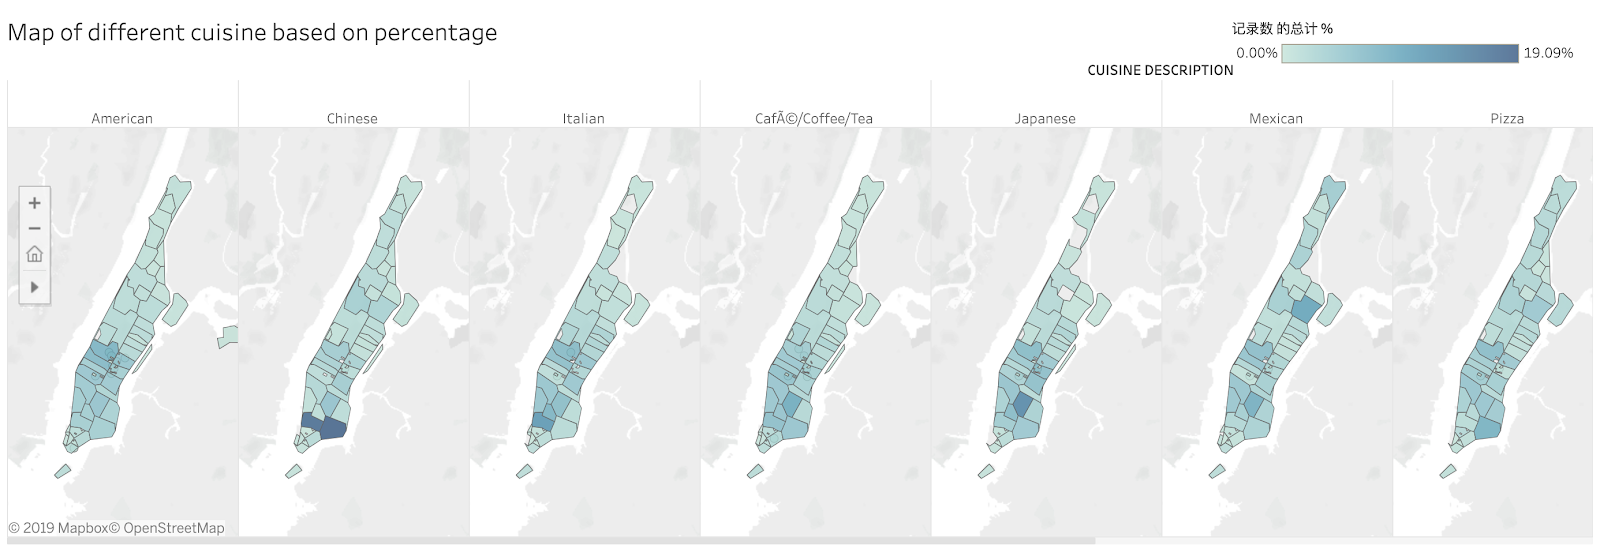
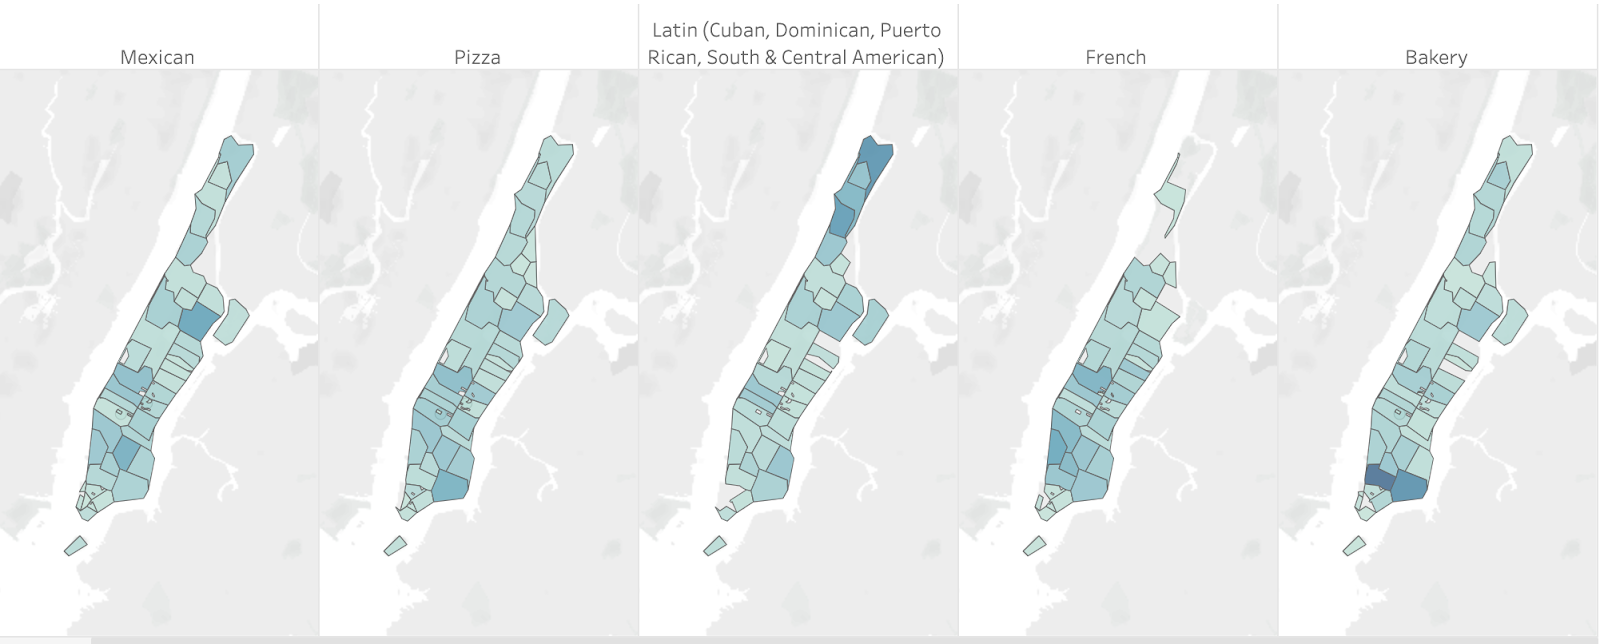
- Make the separate map of top cuisines: then, I made the distribution maps of every cuisine and chose the top ten cuisines in the filter. Also, colored them by percentage to let them evenly distributed in the map. This time, my maps did tell stories and here’s my findings: As you can see as img 7 below, American food distributed very evenly in Manhattan which matches the fast food everywhere fact I talked before. Also, there seems a little more American food around 40 street. I guess that is Time Square area. What’s more, most of the Chinese food is in Chinatown, Italian food is in Little Italy, and Japanese food is in J-town. Latin food is obvious in uptown. I think maybe because of more Latin people there. Also, coffee and tea are more around downtown, which I think would be Chelsea area, and pizza around East Village, etc.
After getting good maps in Tableau, I felt that was not enough. I still wanted to make a cartoon map. However, the map I got was separated by cuisine, so if I merge all ten map together and pick the representative food for every neighborhood, does that still make sense? I did know that, so I conducted the user interview to figure it our.
User Interview:
My map’s target audience are all people related to New York, so I choose one user who lived here and another is potential NYC tourist in this summer from China. I ask their impression of New York’s food, also discuss my thought with them. Here are some highlight information I get from them.
- User 1: Pratt student who lived in New York for almost two years. She said that even though American food is everywhere in New York, people still have an impression of some area’s representative food and in most cases they are not American food.
- User 2: Designer in a Chinese company who is going to visit New York in this summer. He loved my idea and encouraged me to do it. He said that he would love to use it as a food guide for New York. He could have roughly understood what food he should look for in some area. Also, it would be a culture introduction for him as well.
- The User interview was very supportive for me. They also remind me that the inspiration maps I showed in the beginning are also the combination of data and personal understanding. I’ll take it as a sacrifice for cartoon map. Therefore, I going to make the cartoon map as I planned.
Draw cartoon map:
Draw guideline: Draw guideline: I use Goodnotes on iPad to divided Manhattan by cuisine types instead of neighborhood at first(img 8). Some cuisine may have more than one neighborhood, and this step is solving that problem. I chose those neighborhoods which have an obvious trending in those top 10 maps, but for some parts that without any representative distribution, I make them all American food. Goodnotes as the tool I chose in this step because that it could let me start easy and quickly, also the digital map could let me use directly in the next step. I need a rough guideline in this step so that it would be perfect for me.
Draw doodles and header: Then I draw the outline of all cuisine using clear lines. I used Procreate because it let me use lots of layers, so that I could make the roughly guideline(img 8) as a image on the base and draw the lines on it and dram different cuisines on different layers in case I need change any. Also, when you hold the line a little longer, they all turn to the straight lines automatically.


Then, I doodled all different cuisines. I searched them one by one on Pinterest to see what foods come up at first. It was quite smoothly when I drew Chinese or Japanese food because of familiarity, but when it came to those Latin food, it was really tough. I couldn’t distinguish the difference between Latin food and Mexican food. Also, for American food, sorry I drew all junk food there! Besides, I put all description and the header on the top. Here is the time lapse video below.
Results:
I keep the total number of whole cuisines by bar chart and the top ten cuisines’ distribution percentage by map as the img 6 below.
Also the final graphic: cartoon map of Manhattan’s food map.

Reflection:
Here are some thoughts about next step(revision): make it interactive. I want it to be more helpful, so maybe users could jump to Google Map by clicking one area. Also, maybe the top three restaurants in that area will pop up when hover on it. Some Yelp data is available but definitely big and not easy to clean.
On class, I got a very useful feedback that what’s the rationale behind my doodles. I just randomly transfered the food what I searched on Google to doodles. It probably make more sense if I choose the most representative food by data, but that may not be the easiest one for users to recognize, neither.
My result is only about food. It’s funny but not comprehensive. Maybe Kimie’s New York sensation map, Tiehan’s International students’ map and my food map should combine together to provide more information for people related to NYC.
What’s more, one thing I learned in this work is that when I stuck in a problem, I should step back and think about it from a higher level. Sometimes it may not the problem I should struggle. Like in this work, teaching assistant and I worked a long time on how to build the overall cuisine map by neighborhood, which PhD Sula found that it should not even be a problem by looking at the total number’s bar chart. Keep that in mind would save me a lot of time.