Tag: information visualizationPage 2 of 2
For this project, we wrote Python scripts to manipulate data from the Spanish Artists Dictionary, a research resource created by the Frick Art Reference Library. The first portion focused on distilling and organizing data in order to create visualizations using Tableau Public, while the second portion involved using Python to clean and enrich the dataset by matching names against an authority list of subject headings. This presentation will outline the two parts of the project and explain how Python was applied to a cultural heritage dataset.
The Donor Party, www.thedonorparty.com, is a linked open data website created by Pratt SILS students in The Museum and the Network class. It contains a home-made database and…
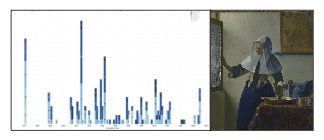
Dutch Baroque Paintings at The Metropolitan Museum of Art: A Quantitative Assessment of a Collection
These visualizations are based on the metadata assigned to The Metropolitan Museum of Art’s Dutch-painting collection. They are meant to facilitate trend detection and sense making with respect to the Museum’s acquisitions history and collection strengths in this fine-art area.
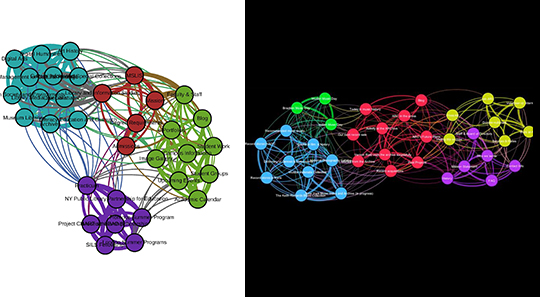
The selection of authors in the network is made up of fiction and poetry writers of various subdivisions. The Network of Literary Authors is derived from curated SPARQL queries for ‘influenced/influenced by’ DBpedia properties and shows color groupings representing only 19 communities based on influence connections between nearly 1000 authors.
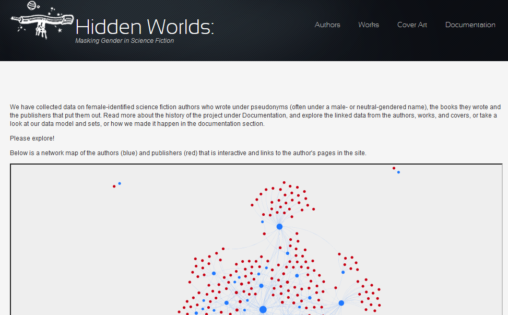
This project conducted network analysis research on an online database of female-identified science fiction writers who wrote under pseudonyms, focusing particularly on those that used pseudonyms that were…
This is a short music video of digital photos of the final graphic novel project of student J.D. Arden. The goal of this project was to create an…
For our final project we were asked to create a 5-8 page comic book with educational aims. I chose to focus on the 3rd Wave of Feminism, or…
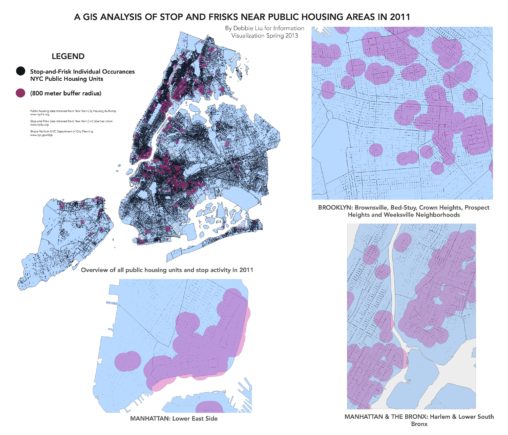
This mapping project examines stop and frisk data and public housing data.
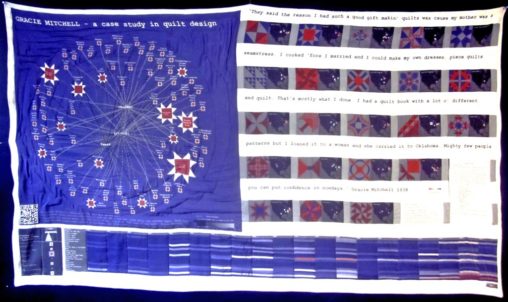
This data quilt, an information visualization, is the second in a series of textile objects that archive an ongoing digital humanities research project/blog: Runaway Quilt Project.
This project uses data generated in LIS 643 and network visualization software used in LIS 658 to analyze participants’ grouping of web pages during a cardsort exercise and explores the efficacy of using network visualizations of this data.
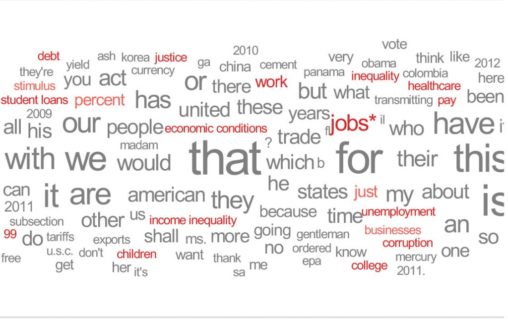
This poster summarizes the history and impact of the Occupy Movement, using government sources and data to put together the story.