Majority Party Shifts in the U.S. Congress: How Historical Fear Inducing Events Alter the Political Landscape
October 10, 2018 - All
INTRODUCTION:
Today’s political landscape has been characterized as a culture of fear. It has been invoked in concrete and abstract ways and channeled by politicians as they spread their messages to the electorate. But fear has ebbed and flowed throughout American political history, and by no means is unique to this country or a political party. As history shows, fear has the power to jolt the electorate in different directions, and when strong enough, it can override voter’s preexisting partisan categories. These moments of reorder and destabilization have been a part of the electoral landscape since the beginning of this nation.
In this visualization, the history of the U.S. House of Representatives and Senate are examined to assess how political party majorities have been affected by historical events that are spawning grounds for fear. Historical events included in this particular visualization are wars, assassinations, financial crises, and a few other noteworthy events. Events are shown in relation to percentage of seats held by the majority political party throughout the history of the United States. Also for reference, value of seats held and name of political party is shown.
DISCUSSION:
The initial investigation into this data looked into bipartisanship in the U.S. Congress by examining the average overlap of votes between political parties over time. Further research led me to this visualization, which is quite effective in conveying the information and answering questions I had on the topic.
 http://www.mamartino.com/projects/rise_of_partisanship/
Reassessing the data, I explored the shifts in political party majorities, with particular emphasis on the percentage of seats held during each session of congress. After reviewing these shifts in the visualization, I began to research what was happening in the congressional session just before or during these shifts and recognized many included war and financial crises. After adding in data for each major war, financial crises, political assassinations, and a few other noteworthy events, the pattern became clear that during these moments of turmoil and national fear, political parties were able to gain a stronger hold upon congress. Each party has capitalized on these moments and taken control.
MATERIALS:
- Vote View – data source that includes every vote recorded in the U.S. Senate, categorized by session of congress, member, party, roll call vote
- Microsoft Excel – spreadsheet software used to explore data and make a few basic calculations
- Tableau – free software to create interactive data visualizations to be shared in both public and private settings
METHODS:
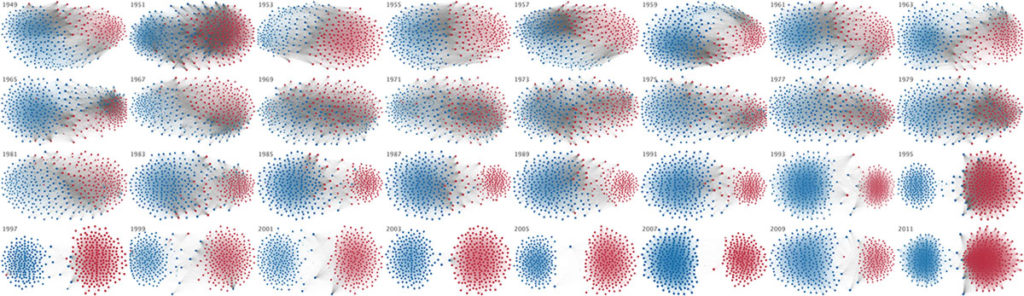
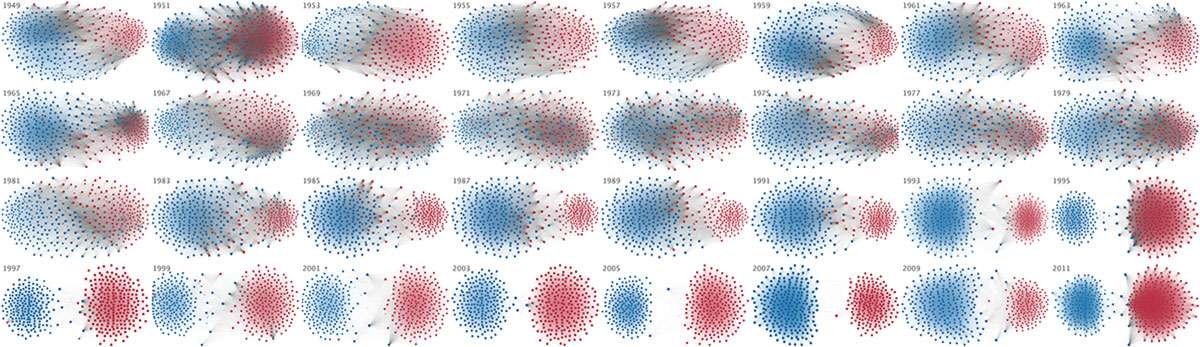
Starting with an investigation into how political party majorities have shifted throughout the history of congress, I began to look into effective ways to communicate this. As member totals have changed throughout our history, depending on number of states in union, redistricting districts, etc., percentages were used to normalize data between sessions. As this was primarily an investigation into when political landscapes tend to shift, the party itself was less important, so color was used to express these shifts for emphasis (Figures 1 and 2).
These figures originally had the number of members on the y-axis, however, the decision to normalize the y-axis was made to give more emphasis on party majority shifts. The changing member count values were confusing the viewer and not adding to the question at hand; while be it interesting to view the increases in members as states were added to the union and temporarily lost during the Civil War.
At this point, the political party graphs (Figures 3 and 4) were included to give context and numerical values to the previous figures. A prior knowledge of the political history of the U.S. is needed to gain much insight from Figures 3 and 4, as the agendas of political parties have changed throughout history so it is important not to assess parties in history as the same as their modern incarnation.
RESULTS:
Figures 1 and 2 express the majority party power shifts through the history of both the House of Representatives and the Senate of the United States. This is shown through percentage of seats held by the majority party. Significant gains by majority parties have been made throughout history during moments of national uncertainty and fear, in particular, during times of war, financial crises, and assassinations. Historical context is given in the timeline through text.
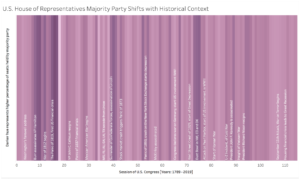 Figure 1 – Public Higher Resolution Link
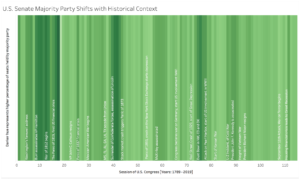 Figure 2 – Public Higher Resolution Link
While a deeper look is certainly needed, it appears that political parties tend to increase majority concentrations during periods of unrest and fear. During these moments of national panic, the electorate is more likely to get behind a particular ideology and allow it to have significantly more power. The political slant of the electorate can shift from their own internal anxiety of the times, as well as external rhetoric from a political party.
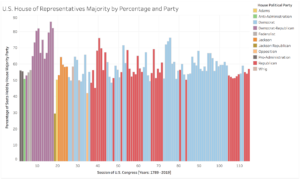
Figure 3 – Public Higher Resolution Link
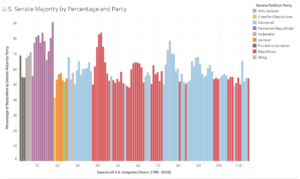
Figure 4 – Public Higher Resolution Link
Figures 3 and 4 give context to this investigation through highlighting majority percentage as well as the political party name. Capitalizing on these moments of turmoil is certainly not unique to any party. It is prudent for the electorate to understand how the nation’s emotional state can allow political parties to increase their power by gaining majority percentages in both the House and Senate.
REFLECTION:
This investigation is meant to be a conversational catalyst, examining congressional data within its historical context. By no means is this a scientific analysis, as the topics covered are complex and open for discussion. That being said, there is clearly a pattern of majority party dominance during periods that are universally understood as turmoil and fear inducing. My interpretation of this correlation is political parties capitalizing on these moments of fear for their benefit, however, there are clearly other ways to explain this pattern.
This lab primary focus for me was getting a handle on the possibilities of Tableau. Before settling on these sheets, I explored different graph types and tried to better understand the formula and calculations possible in the software. The use of Stories and the Dashboard wasn’t used here and requires further investigation in the future; clearly this lab only scratched the surface of the possibilities within Tableau. The process followed was a bit journalistic in nature, exploring a pattern, and then investigating particular moments within the pattern.
In the future, I would like to revisit the question of bipartisanship and combine this with the historical context used in this lab. Does landmark legislation get passed more often by bipartisan support or when a particular party has more control? How is this influenced by the historical context?
The post Majority Party Shifts in the U.S. Congress: How Historical Fear Inducing Events Alter the Political Landscape appeared first on Information Visualization.