
Data Analysis and Visualization of Museums and Related Organizations in the U.S.
October 10, 2018 - All
By Amanda Chen
Introduction
As a student of Museums and Digital Culture in Pratt, I always focus on analyzing data from museums and related institutions in the U.S. even around the world. Museum undertaking the social responsibilities of educating the public, serving for the community, as well as contributing to the economy. In the record of American Alliance of Museums (AAM), American museums support more than 726,000 American jobs; contribute $50 billion to the U.S. economy; have approximately 850 million visits each year, and approximately 55 million visits from students in school groups. Therefore, I chose the Museum Universe Data file to visualize in order to show the distribution of various types of museums and related originations in U. S. and their income performance. To see the final visualizations, check out my visualization dashboard onTableau Public.
Method
My first step before exploring the appropriate worksheet in the online open database, I did some online research of data visualization style created by Tableau, and online materials from the American Alliance of Museums as well. After research, I dig data in several open sources which including Census & American Community Survey, Federal data, Pew Research Center, New York City data, New York State, United Nations, and Enigma Public database.
In order to get the worksheet that presents the critical information and can be visualized into suitable style, I have following requirements when I was searching in the database:
- Only the data related to museums and related institutions;
- More than 1,000 records, and over 6 columns;
- Available CSV format in order to download and import to Tableau;
- The worksheet must have the potential qualities to create at least three visualization styles in Tableau;
I found the target worksheet in Enigma Public database which has 33,072 rows and 49 fields. After that, I used OpenRefine to clean the data, and I only selected eight critical fields to visualize which including Museum name, discipline code, longitude and latitude, zip code, city and state, as well as income. Finally, I created a dashboard in Tableau. To see the database, check out the original worksheet in Enigma Public.
Materials
- Tableau Public: a free data visualization software that enables multiple kinds of visualizations, dashboard creation, publishing to the web, or embedding into web pages.
- OpenRefine: a free and open source tool that helps users to explore, clean and transform large sets of data.
- Enigma Public: is an operational data management and intelligence company that specializes in data analytics and connected data.
- Institute of Museum and Library Service—Museum Universe Data File: It includes basic information on aquariums, arboretums, botanical gardens, art museums, children’s museums, general museums, historic houses and sites, history museums, nature centers, natural history and anthropology museums, planetariums, science and technology centers, specialized museums, and zoos. The initial data collection occurred in 2013 from Institute of Museum of Library Services administrative records for discretionary grant recipients, IRS (Internal Revenue Service) records for tax-exempt organizations and the recipients of grants from private foundations.
- American Alliance of Museums (AAM): is a non-profit association that has brought museums together since its founding in 1906, helping develop standards and best practices, gathering and sharing knowledge, and advocating on issues of concern to the museum community.
Results and Interpretations
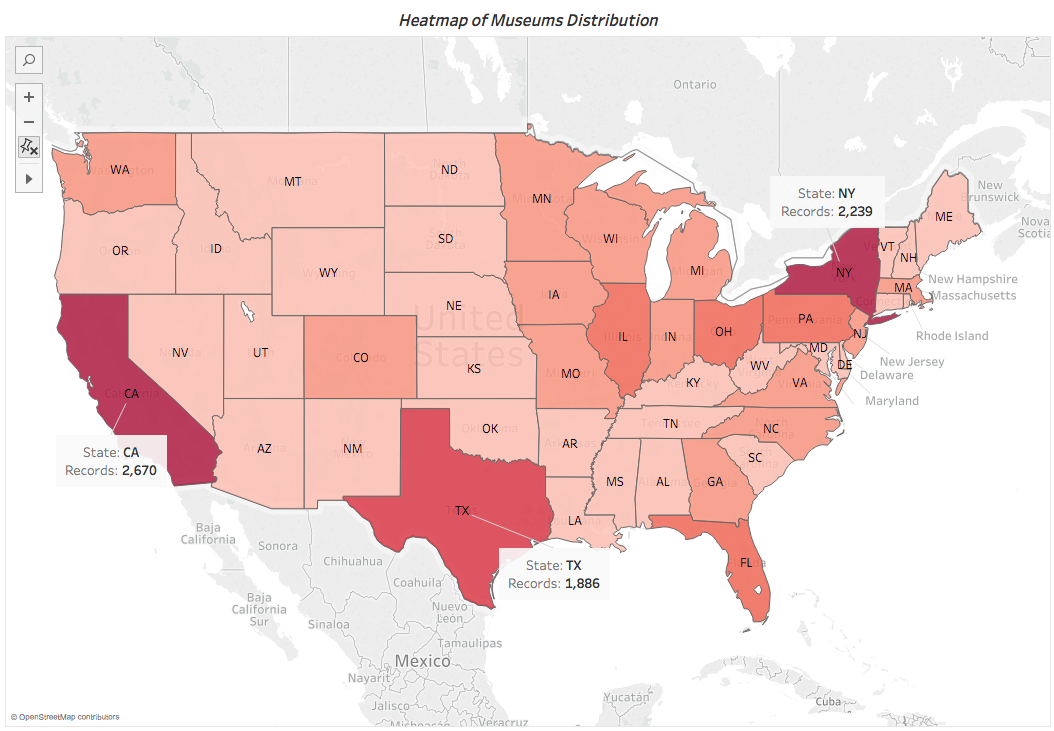
This is the state distribution heatmap of museums and related organizations in the United States. We can clearly see that California, New York, and Taxis these three states got the most number of museums which the numbers are 2,670, 2,239 and 1,886 records.
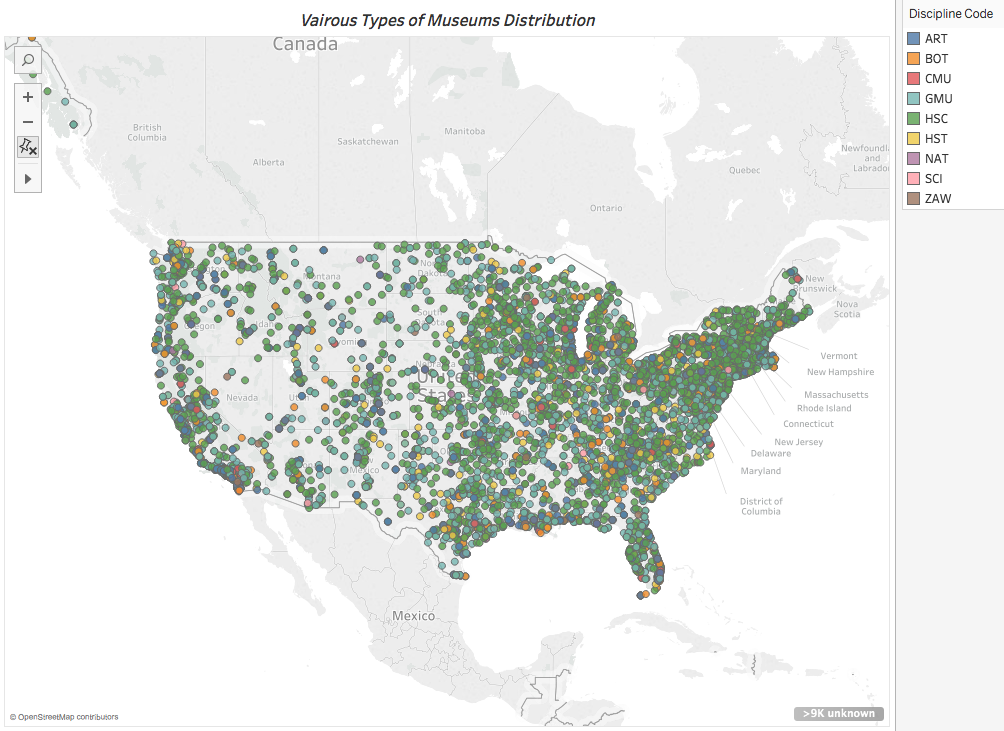
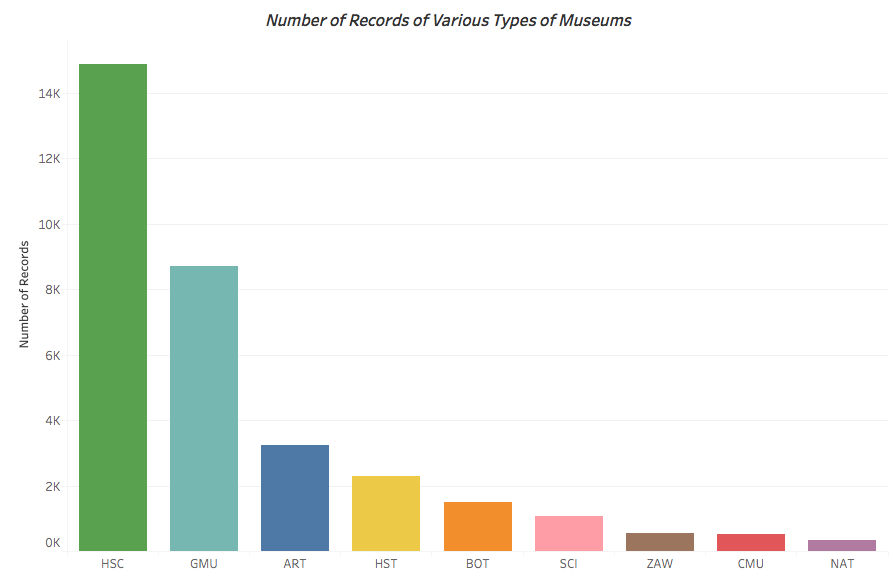
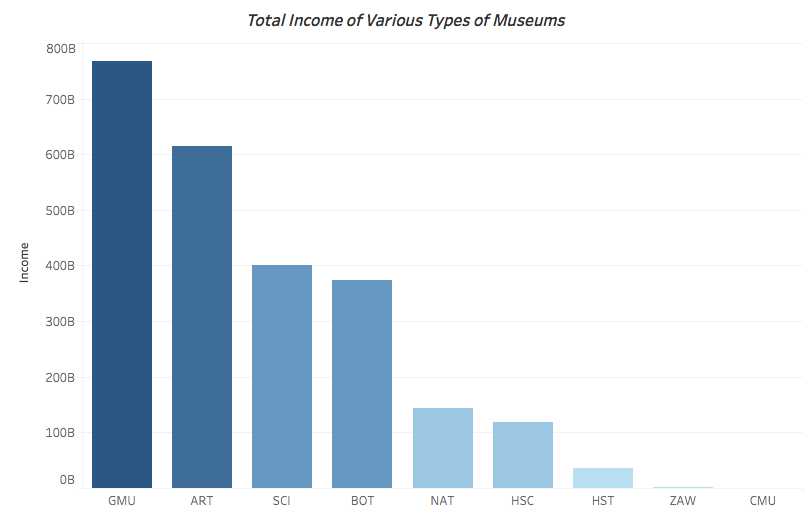
Then, I used the museum discipline code of the organization as the measurement. These include the following terms: ART – Art Museum; BOT – Arboretums, Botanical Gardens & Nature Centers; CMU – Children’s Museums; GMU – Uncategorized or General Museums; HSC – Historical Societies, Historic Preservation; HST – History Museums; NAT – Natural History & Natural Science Museums; SCI – Science & Technology Museums & Planetariums; ZAW – Zoos, Aquariums, & Wildlife Conservation.
In these two charts, we can perceive that there are over 14,000 historical Societies in the U.S. and they distributed all over the country.
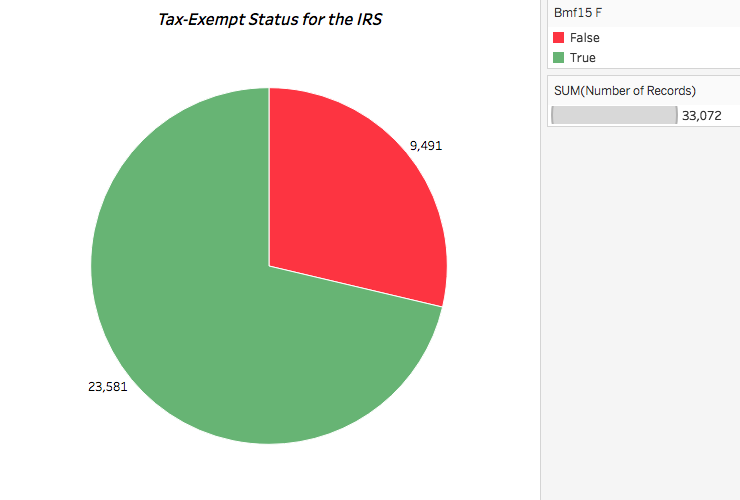
Bmf15 F means the Internal Revenue Service’s Business Master File May 2015 flag. This flag indicates that this record was found in the most recent IRS 990 Business Master File Data. The IRS Business Master File (BMF) contain descriptive information for all active organizations (public charities, private foundations, etc.) that have registered for tax-exempt status for the IRS. In the total 33,072 records, there are over 70% of museums are have tax-exempt status.
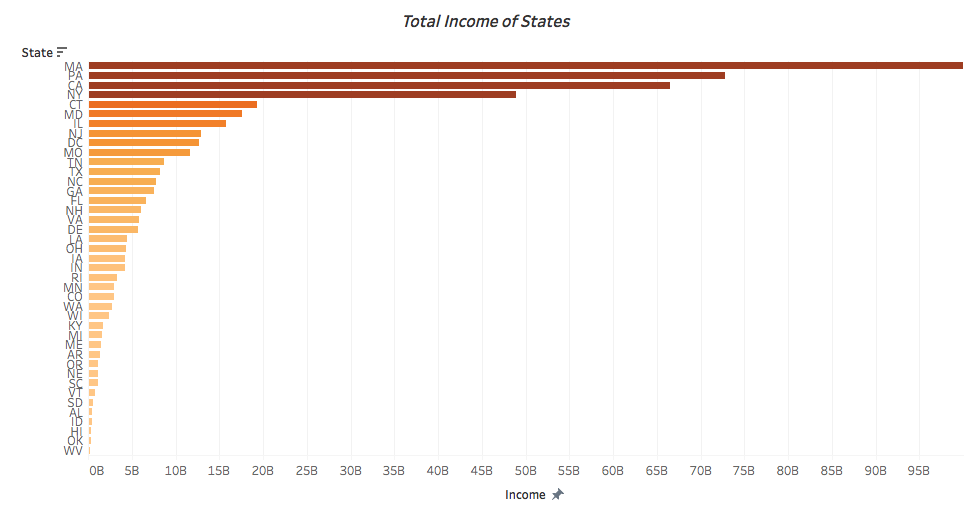
Income
Gross receipts from most recent Internal Revenue Service (IRS) 990 form. Income is a computer generated amount by the IRS. Information comes from IRS Business Master File, May 2015.
Reflections
In my perspective, the most difficult part for the whole project is to find the perfect data because I have many requirements about it, and most data worksheets have its flaws and limitations such as hard to visualize, have fewer measurement criteria as well. In the orginal worksheet that I chose
- Non-museum organizations may be included.
- Museums may be missing.
- Museums may be listed multiple times.
The post Data Analysis and Visualization of Museums and Related Organizations in the U.S. appeared first on Information Visualization.