
Film Tax Credit — Productions
August 1, 2018 - All
NYS Governor’s Office for Motion Picture & Television Development offers a Film Production Tax Credit for 30% of qualified costs for eligible New York State productions and an extra 10% credit labor costs incurred in Upstate New York. In order to qualify for the tax credit, productions must fit the criteria set by New York State. These productions must have a set and shoot at least one day in New York State to be eligible. [https://www1.nyc.gov/nycbusiness/description/film-production-tax-credit]
The program which started in 2011, has generated $20.9 billion in spending and brought 1,300,358in film and production to New York state increasing growth in the film industry. There are thousands of locations including historic architecture, industrial complexes, rural towns and picturesque farms, plus the wilderness of the Adirondack Mountains and beaches. [https://esd.ny.gov/industries/tv-and-film ]
Research was conducted and trends explored in form of visual data analysis to seek more information on production locations through New York State. The data analyzed came from the data.gov database. This data recorded productions and stage locations beginning in 2004 and is organized by counties. Analysis of this data sought to discover location trends and program popularity. The question to be answered was if the program was successful, where are the most popular production locations, and if county trends match overall trends.
Design process
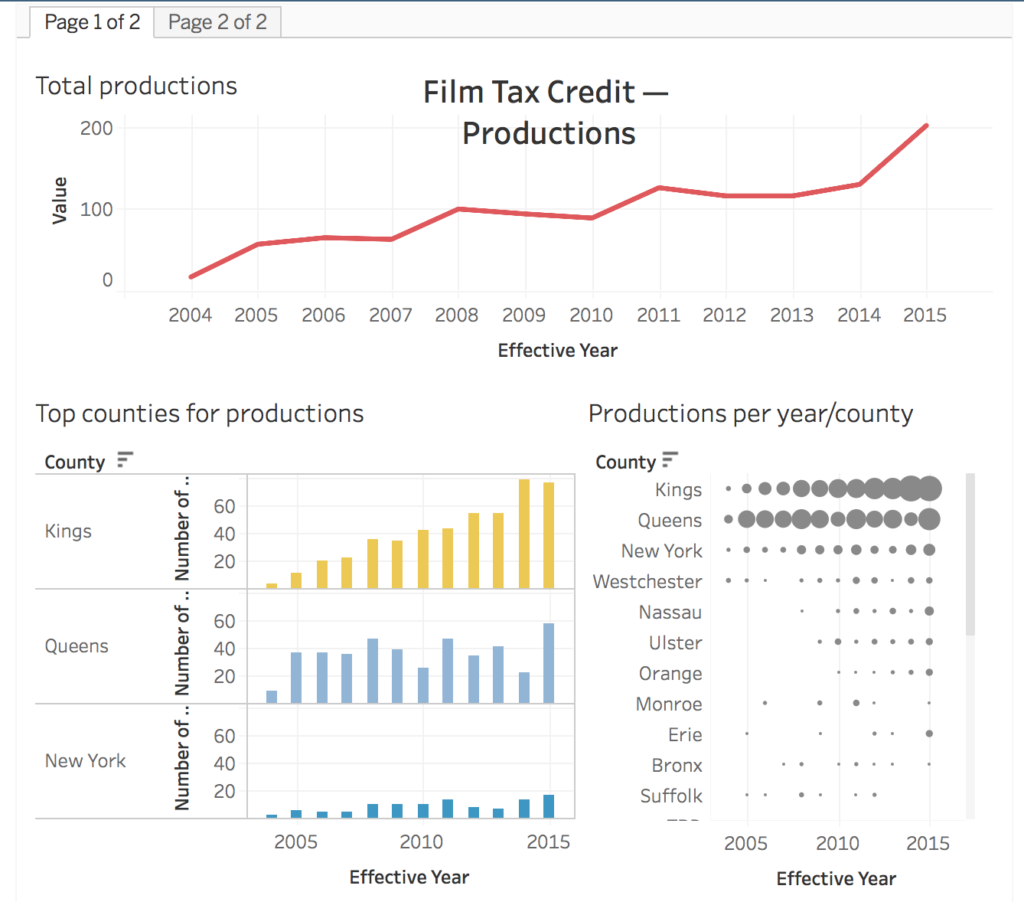
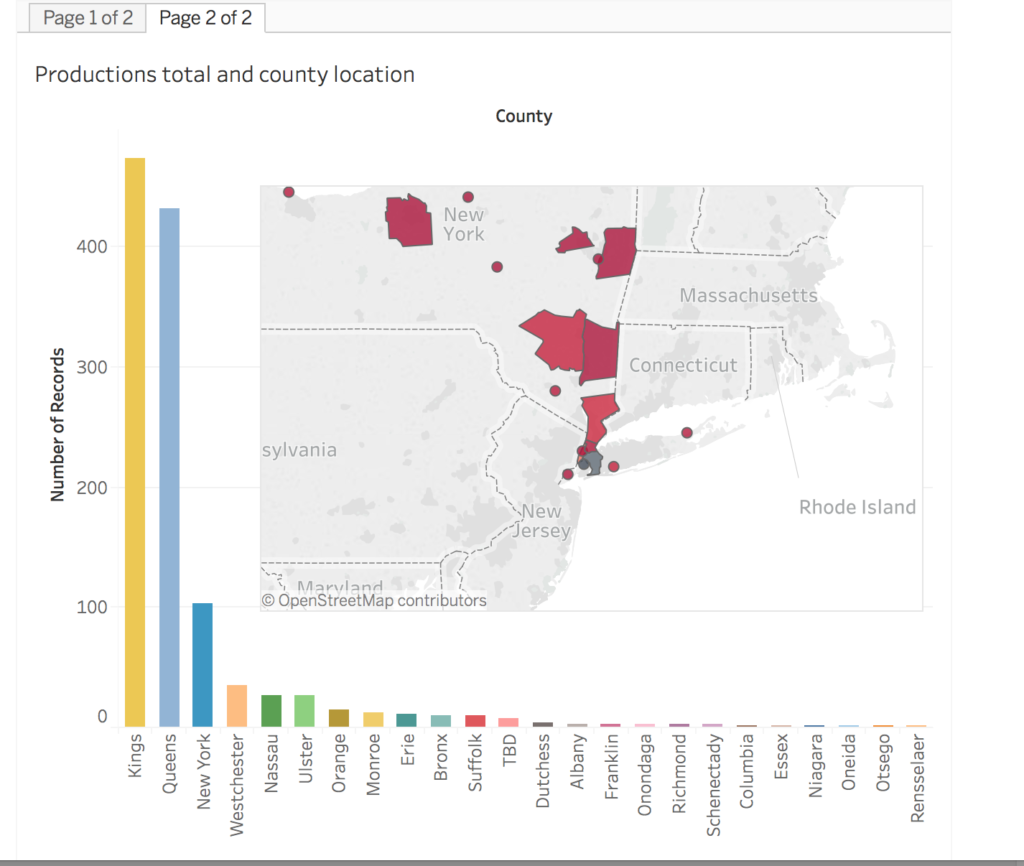
In order to create a story through data, the data set was brought into the Tableu software where visual dashboards were developed. Sheet contained the individual charts, each distinct with time or location based data. The dashboard contains charts showing yearly and total trends broken down by county and a map for reference. Distinct colors were used portray differences between each county. The top three production producing counties broken down by year and highlighted production totals. In the map users are able to quickly see popular locations and hover and scroll for exact measures for each county.
https://public.tableau.com/profile/jamie.raymond#!/vizhome/Productions_finalLab/Page1of2?publish=yes
Inspiration
National Feature Films Produced
The idea for this visualization stemmed from a previous assignment which involved productions from different countries around the world. Since 2005 there was a steady increase of productions with the top three including India leading, US not far behind, and Nigeria in third place. US had a slight trend of increased over the years.
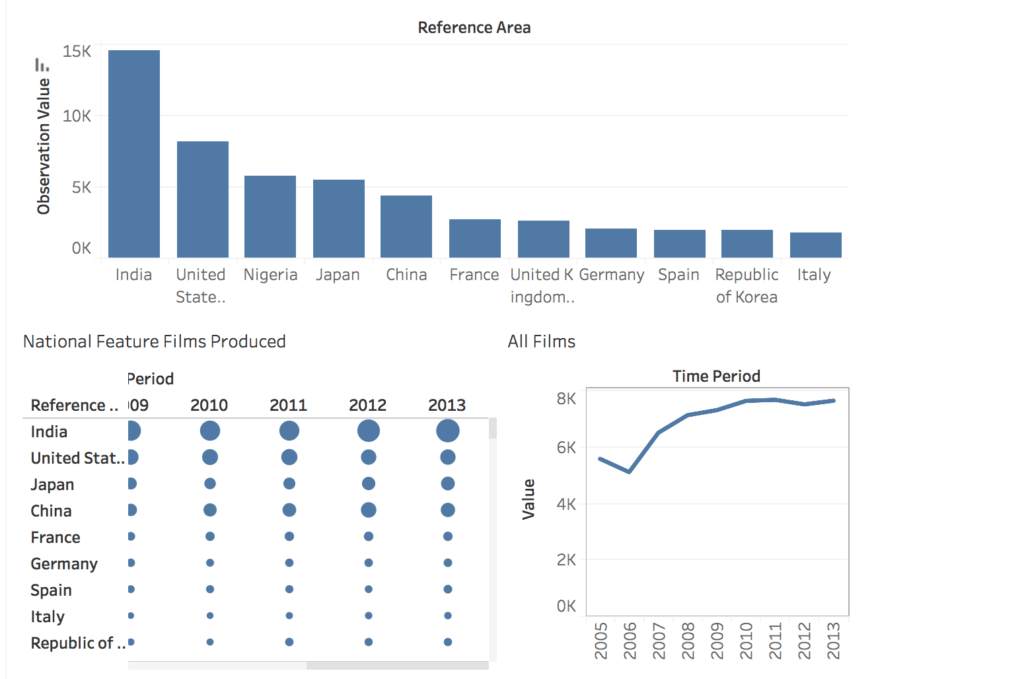
http://studentwork.prattsi.org/infovis/2018/07/10/undata-national-feature-films-produced/
Languages in the World
This map inspiration is comprised of a simple color palettes, intricate shape, and small circles. The high contrast of data points to vs the light colored map draws the eye to areas of high and low concentration. It shows how a simple dot on a map can convey meaning and help tell the story.

http://snip.ly/pJsZ#http://www.puffpuffproject.com/languages.html
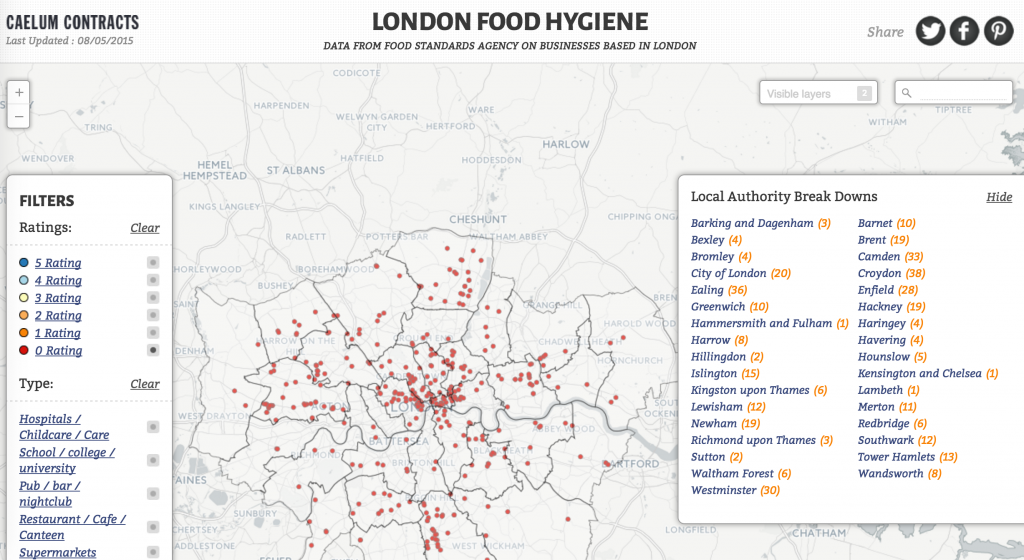
London Food Hygine
Another example of a map visualization on zoomed in level from the previous example. This map has a deeper level of detail and also conveys the data through dots. A darker colored link outlines the local authority boundaries and gives a convenient legend to the right. Share links on the top right make it easy for viewer to share with their networks.
Findings & Recommendations
The program is on a steady increase of popularity
Due to the popularity of the program New York State may consider expanding the program length or increasing the initiative percentage to attract even more productions. On the other end this upward trend of production totals may influence the need for the incentive program if production totals start to match or exceed expectations. There could be room to expand the program or other cities in the US and globe may wish to adopt this program.
Brooklyn, Kings County, Queens, and New York, NY are the most popular locations
Understanding where the largest batch of productions are located can help producers decide where they want to film by either following suit to the most popular locations or choosing less popular locations. The locations which have a greater number of productions can also be attributed to film studios located in these areas. World-class soundstages include Steiner Studios, Silvercup Studios, Kaufman Astoria Studios and Broadway Stages. [https://esd.ny.gov/industries/tv-and-film] The popularity may suggest to an audience of prestige in certain locations.
New York is a large state and only three counties contain the bulk of productions
The last recommendation would be to look at increasing initiative to produce films in other parts of the state. There could be a greater tax credit for counties in New York which could benefit from revenue and/or media influence. Producers may shy away from other counties in the state after seeking the differences in the visual. New York state can create individual county plans to entice users to film a production.
UX Research
Once the two page dashboard was completed and published to Tableu Public UX research was conducted. Three participants were recruited and in order to recruit participants to give the most useful feedback, only those who had a connection to film production, acting or the performing arts. The participants could be grouped into two categories, film students and amateur film maker.
During each 15 minute UX assessment the participant was asked to answer two questions and give any additional feedback. The questions included:
Is this visual relevant to what you do?
How could this visual impact your decisions surrounding film production location decisions?
Feedback
The UX research revealed areas of improvement for future directions. Feedback was consistent between the two user groups. Overall they found the visual to be relevant and wanted to know how to get more information.
One user stated “Where can I go to find out more?”
Users found the visual interesting and were not aware of the New York film tax credit. Having knowledge of this program seemed to spark interest in creating a film and location ideas.
“I’m shooting my next film in the city. And it’s going to be magnificent, just wait and see.”
Conclusion
Findings from the visual and user feedback suggest there is growth opportunity for the program and expansion throughout the state. Although the program is increasing in production amounts, some audiences may not be aware of the program. After viewing this visualization users wanted to learn more. Future directions of the Film Tax Credit visualization will include more ways for viewers to link to a page where they can find more detailed information about signing up for the incentive. Some additional metrics to include could revenue including total and per county. It may be useful for those who want more information to have a link to learn about each county as well. To see where they might be interested in filming next.
The post Film Tax Credit — Productions appeared first on Information Visualization.