PEOPLE REPORTING ANCESTRY – US Native American Indian
July 17, 2018 - All
Written by Jamie Raymond
Information Visualization Summer Course at Pratt Institute
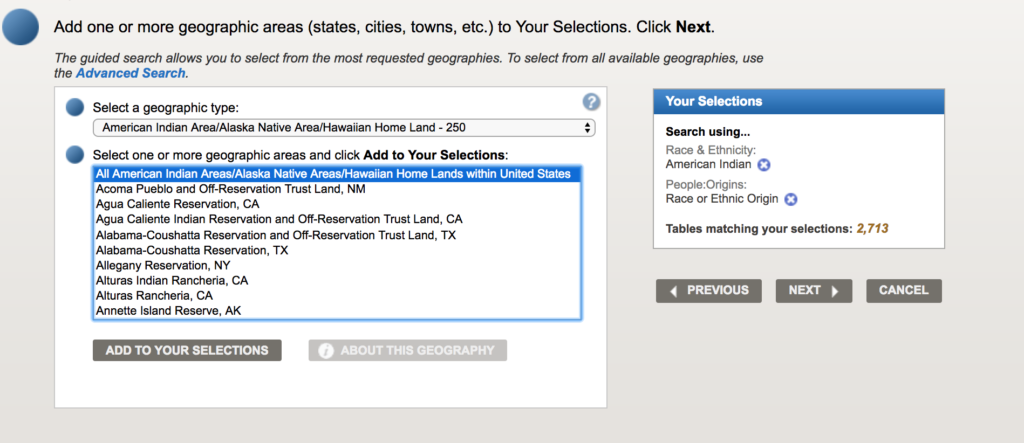
This data set analyzes ancestry of all American Indian Areas/Alaska Native Areas/Hawaiian Home Lands within the United States in 2016 census found on United States census Fact Finder website, https://factfinder.census.gov/ using the following filter options:

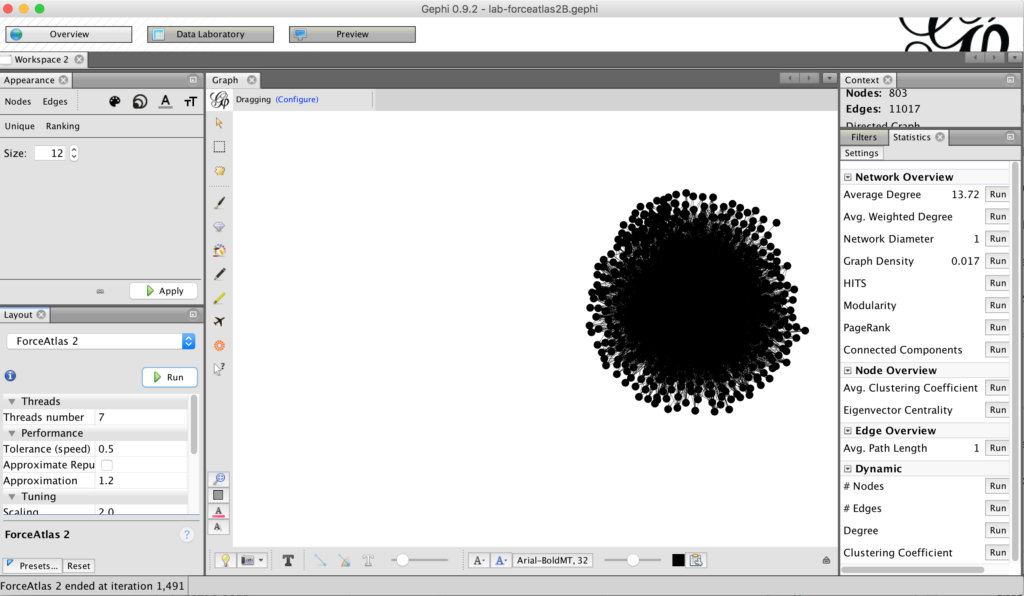
The Data was optimized for Gephi by cleaning in Open Refine by organizing data by notes and edges. It was opened in Gephi where a visual was created to help understand connections between the individual data points of the network structure. The ForceAtlas 2 layout was used and showed a web of moving circles. Due to the amount of countries of ancestry it is hard for the computer to render each node. What is clear is that there seems to be an even spread of relations. The Gephi software itself is very sensitive and users must save often. Once a change is made there is not turning back so it is common to have multiple instances of the same file.
INSPIRATION
Dead Kennedys
Project Description: A visual overview of Dead Kennedys’ five studio albums including quotes of the lyrics, track titles, album titles and their release years, soundwaves, track lengths, song writers and the lyrical themes and their relations.
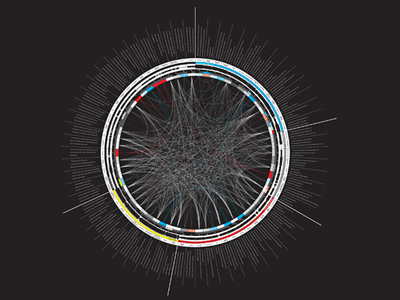
This radial diagram shows a web of complexity of the most important career highlights for this famous band. The eye can track areas around the circle through use of bright colors that stand out. The web in the middle leads the eye to clusters near these blocks of color and segments.
http://www.visualcomplexity.com/vc/project_details.cfm?id=772&index=772&domain=
Hospital System – From client to Patient
Project Description: The project featured here is a user-centered map of the Hospital System (from client to patient).
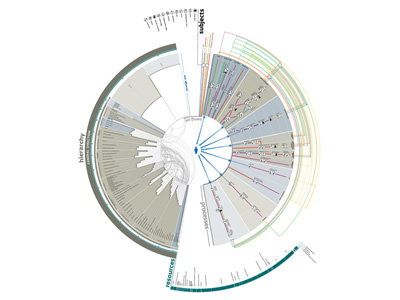
Another radian diagram with nice visual splits and efficient use of color. Breakpoints organize information with brighter colors as leads.
http://www.visualcomplexity.com/vc/project_details.cfm?id=548&index=548&domain=
NYC Subway Map Redesign
Description: Eddie Jabbour, Creative Director at Kick Design, New York, is a tireless advocate for a new map design and communication solution for the world’s most complex subway system. The NYC subway is indeed a challenge by itself. It has the biggest number of stations in the world (468), the second longest network and it’s seventh in daily passenger numbers.
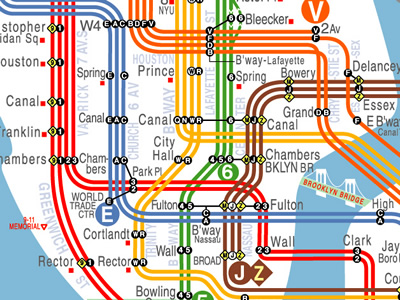
Color, lines and lettered points compromise this network. Clear contrasting colors are careful not to blend together so the user can trace their eye along the route.
http://www.visualcomplexity.com/vc/project_details.cfm?id=267&index=267&domain=
Results
OpenRefine was used to optimize data with nodes and edges for Gephi. Using the software can prove challenges to rendering so it is best practice to save often and use multiple versions. Color, size, and perspective all play a role in analyzing and understanding data. Future work may include better rendering of labels and size variation to show contrast.
The post PEOPLE REPORTING ANCESTRY – US Native American Indian appeared first on Information Visualization.